Hopi vs Immigrants from Ecuador College, Under 1 year
COMPARE
Hopi
Immigrants from Ecuador
College, Under 1 year
College, Under 1 year Comparison
Hopi
Immigrants from Ecuador
57.1%
COLLEGE, UNDER 1 YEAR
0.0/ 100
METRIC RATING
314th/ 347
METRIC RANK
58.7%
COLLEGE, UNDER 1 YEAR
0.0/ 100
METRIC RATING
298th/ 347
METRIC RANK
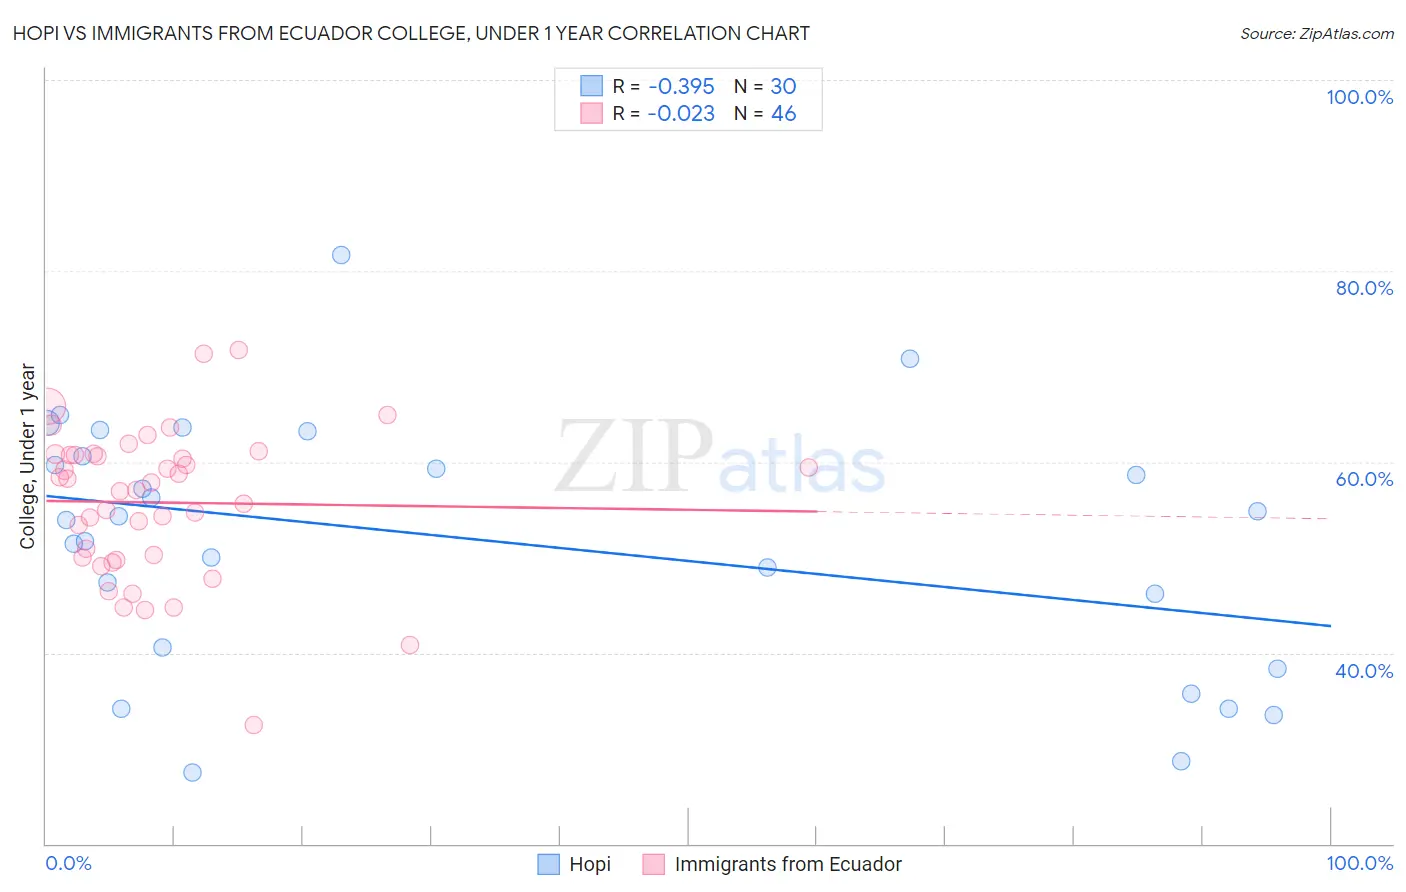
Hopi vs Immigrants from Ecuador College, Under 1 year Correlation Chart
The statistical analysis conducted on geographies consisting of 74,740,168 people shows a mild negative correlation between the proportion of Hopi and percentage of population with at least college, under 1 year education in the United States with a correlation coefficient (R) of -0.395 and weighted average of 57.1%. Similarly, the statistical analysis conducted on geographies consisting of 270,962,752 people shows no correlation between the proportion of Immigrants from Ecuador and percentage of population with at least college, under 1 year education in the United States with a correlation coefficient (R) of -0.023 and weighted average of 58.7%, a difference of 2.9%.
College, Under 1 year Correlation Summary
| Measurement | Hopi | Immigrants from Ecuador |
| Minimum | 27.5% | 32.4% |
| Maximum | 81.7% | 71.7% |
| Range | 54.2% | 39.3% |
| Mean | 51.8% | 55.7% |
| Median | 54.1% | 57.5% |
| Interquartile 25% (IQ1) | 40.5% | 49.9% |
| Interquartile 75% (IQ3) | 60.6% | 60.7% |
| Interquartile Range (IQR) | 20.0% | 10.8% |
| Standard Deviation (Sample) | 13.1% | 7.8% |
| Standard Deviation (Population) | 12.9% | 7.7% |
Demographics Similar to Hopi and Immigrants from Ecuador by College, Under 1 year
In terms of college, under 1 year, the demographic groups most similar to Hopi are Honduran (57.1%, a difference of 0.040%), Menominee (57.0%, a difference of 0.10%), Dutch West Indian (57.2%, a difference of 0.12%), Salvadoran (57.3%, a difference of 0.36%), and Cajun (57.3%, a difference of 0.42%). Similarly, the demographic groups most similar to Immigrants from Ecuador are Cuban (58.6%, a difference of 0.13%), Immigrants from Guyana (58.5%, a difference of 0.39%), Guyanese (59.0%, a difference of 0.50%), Central American Indian (59.0%, a difference of 0.55%), and Mexican American Indian (58.1%, a difference of 1.0%).
| Demographics | Rating | Rank | College, Under 1 year |
| Central American Indians | 0.0 /100 | #296 | Tragic 59.0% |
| Guyanese | 0.0 /100 | #297 | Tragic 59.0% |
| Immigrants | Ecuador | 0.0 /100 | #298 | Tragic 58.7% |
| Cubans | 0.0 /100 | #299 | Tragic 58.6% |
| Immigrants | Guyana | 0.0 /100 | #300 | Tragic 58.5% |
| Mexican American Indians | 0.0 /100 | #301 | Tragic 58.1% |
| Apache | 0.0 /100 | #302 | Tragic 58.0% |
| Immigrants | Dominica | 0.0 /100 | #303 | Tragic 57.9% |
| Kiowa | 0.0 /100 | #304 | Tragic 57.8% |
| Haitians | 0.0 /100 | #305 | Tragic 57.8% |
| Immigrants | Portugal | 0.0 /100 | #306 | Tragic 57.7% |
| Fijians | 0.0 /100 | #307 | Tragic 57.7% |
| Central Americans | 0.0 /100 | #308 | Tragic 57.7% |
| Immigrants | Nicaragua | 0.0 /100 | #309 | Tragic 57.6% |
| Pueblo | 0.0 /100 | #310 | Tragic 57.4% |
| Cajuns | 0.0 /100 | #311 | Tragic 57.3% |
| Salvadorans | 0.0 /100 | #312 | Tragic 57.3% |
| Dutch West Indians | 0.0 /100 | #313 | Tragic 57.2% |
| Hopi | 0.0 /100 | #314 | Tragic 57.1% |
| Hondurans | 0.0 /100 | #315 | Tragic 57.1% |
| Menominee | 0.0 /100 | #316 | Tragic 57.0% |