Pima vs Tsimshian College, Under 1 year
COMPARE
Pima
Tsimshian
College, Under 1 year
College, Under 1 year Comparison
Pima
Tsimshian
51.4%
COLLEGE, UNDER 1 YEAR
0.0/ 100
METRIC RATING
345th/ 347
METRIC RANK
64.3%
COLLEGE, UNDER 1 YEAR
17.9/ 100
METRIC RATING
198th/ 347
METRIC RANK
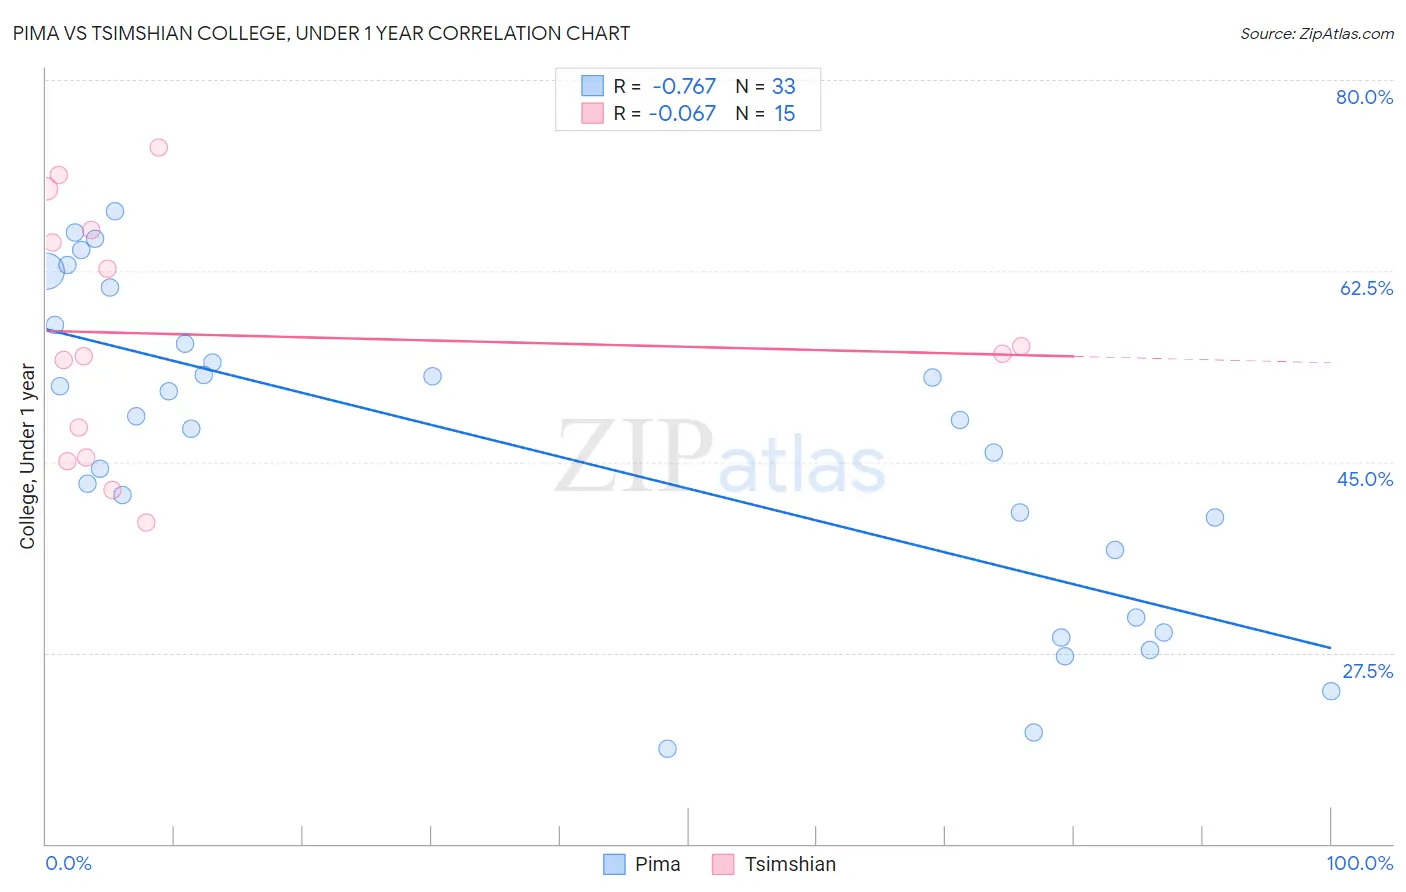
Pima vs Tsimshian College, Under 1 year Correlation Chart
The statistical analysis conducted on geographies consisting of 61,552,513 people shows a strong negative correlation between the proportion of Pima and percentage of population with at least college, under 1 year education in the United States with a correlation coefficient (R) of -0.767 and weighted average of 51.4%. Similarly, the statistical analysis conducted on geographies consisting of 15,626,544 people shows a slight negative correlation between the proportion of Tsimshian and percentage of population with at least college, under 1 year education in the United States with a correlation coefficient (R) of -0.067 and weighted average of 64.3%, a difference of 25.1%.
College, Under 1 year Correlation Summary
| Measurement | Pima | Tsimshian |
| Minimum | 18.7% | 39.5% |
| Maximum | 68.0% | 73.8% |
| Range | 49.3% | 34.3% |
| Mean | 46.2% | 56.6% |
| Median | 48.9% | 54.9% |
| Interquartile 25% (IQ1) | 33.9% | 45.5% |
| Interquartile 75% (IQ3) | 56.7% | 66.2% |
| Interquartile Range (IQR) | 22.9% | 20.8% |
| Standard Deviation (Sample) | 14.2% | 11.1% |
| Standard Deviation (Population) | 14.0% | 10.7% |
Similar Demographics by College, Under 1 year
Demographics Similar to Pima by College, Under 1 year
In terms of college, under 1 year, the demographic groups most similar to Pima are Yakama (52.6%, a difference of 2.4%), Tohono O'odham (52.8%, a difference of 2.7%), Immigrants from Mexico (53.7%, a difference of 4.3%), Immigrants from Cabo Verde (53.7%, a difference of 4.4%), and Spanish American Indian (54.0%, a difference of 5.0%).
| Demographics | Rating | Rank | College, Under 1 year |
| Yuman | 0.0 /100 | #333 | Tragic 55.1% |
| Immigrants | Azores | 0.0 /100 | #334 | Tragic 54.7% |
| Inupiat | 0.0 /100 | #335 | Tragic 54.6% |
| Pennsylvania Germans | 0.0 /100 | #336 | Tragic 54.5% |
| Immigrants | Central America | 0.0 /100 | #337 | Tragic 54.4% |
| Lumbee | 0.0 /100 | #338 | Tragic 54.2% |
| Immigrants | Dominican Republic | 0.0 /100 | #339 | Tragic 54.0% |
| Spanish American Indians | 0.0 /100 | #340 | Tragic 54.0% |
| Immigrants | Cabo Verde | 0.0 /100 | #341 | Tragic 53.7% |
| Immigrants | Mexico | 0.0 /100 | #342 | Tragic 53.7% |
| Tohono O'odham | 0.0 /100 | #343 | Tragic 52.8% |
| Yakama | 0.0 /100 | #344 | Tragic 52.6% |
| Pima | 0.0 /100 | #345 | Tragic 51.4% |
| Houma | 0.0 /100 | #346 | Tragic 47.6% |
| Yup'ik | 0.0 /100 | #347 | Tragic 45.8% |
Demographics Similar to Tsimshian by College, Under 1 year
In terms of college, under 1 year, the demographic groups most similar to Tsimshian are Panamanian (64.3%, a difference of 0.070%), Nigerian (64.3%, a difference of 0.090%), Costa Rican (64.4%, a difference of 0.13%), French Canadian (64.2%, a difference of 0.13%), and South American (64.2%, a difference of 0.13%).
| Demographics | Rating | Rank | College, Under 1 year |
| Immigrants | Armenia | 28.1 /100 | #191 | Fair 64.7% |
| Immigrants | Thailand | 27.0 /100 | #192 | Fair 64.7% |
| Slovaks | 26.7 /100 | #193 | Fair 64.7% |
| Immigrants | Cameroon | 24.6 /100 | #194 | Fair 64.6% |
| Immigrants | South Eastern Asia | 22.1 /100 | #195 | Fair 64.5% |
| Tongans | 21.2 /100 | #196 | Fair 64.5% |
| Costa Ricans | 19.6 /100 | #197 | Poor 64.4% |
| Tsimshian | 17.9 /100 | #198 | Poor 64.3% |
| Panamanians | 17.0 /100 | #199 | Poor 64.3% |
| Nigerians | 16.7 /100 | #200 | Poor 64.3% |
| French Canadians | 16.3 /100 | #201 | Poor 64.2% |
| South Americans | 16.2 /100 | #202 | Poor 64.2% |
| Uruguayans | 15.6 /100 | #203 | Poor 64.2% |
| Immigrants | Zaire | 14.6 /100 | #204 | Poor 64.1% |
| Peruvians | 13.7 /100 | #205 | Poor 64.1% |