Subsaharan African vs Tsimshian College, Under 1 year
COMPARE
Subsaharan African
Tsimshian
College, Under 1 year
College, Under 1 year Comparison
Sub-Saharan Africans
Tsimshian
63.2%
COLLEGE, UNDER 1 YEAR
4.4/ 100
METRIC RATING
224th/ 347
METRIC RANK
64.3%
COLLEGE, UNDER 1 YEAR
17.9/ 100
METRIC RATING
198th/ 347
METRIC RANK
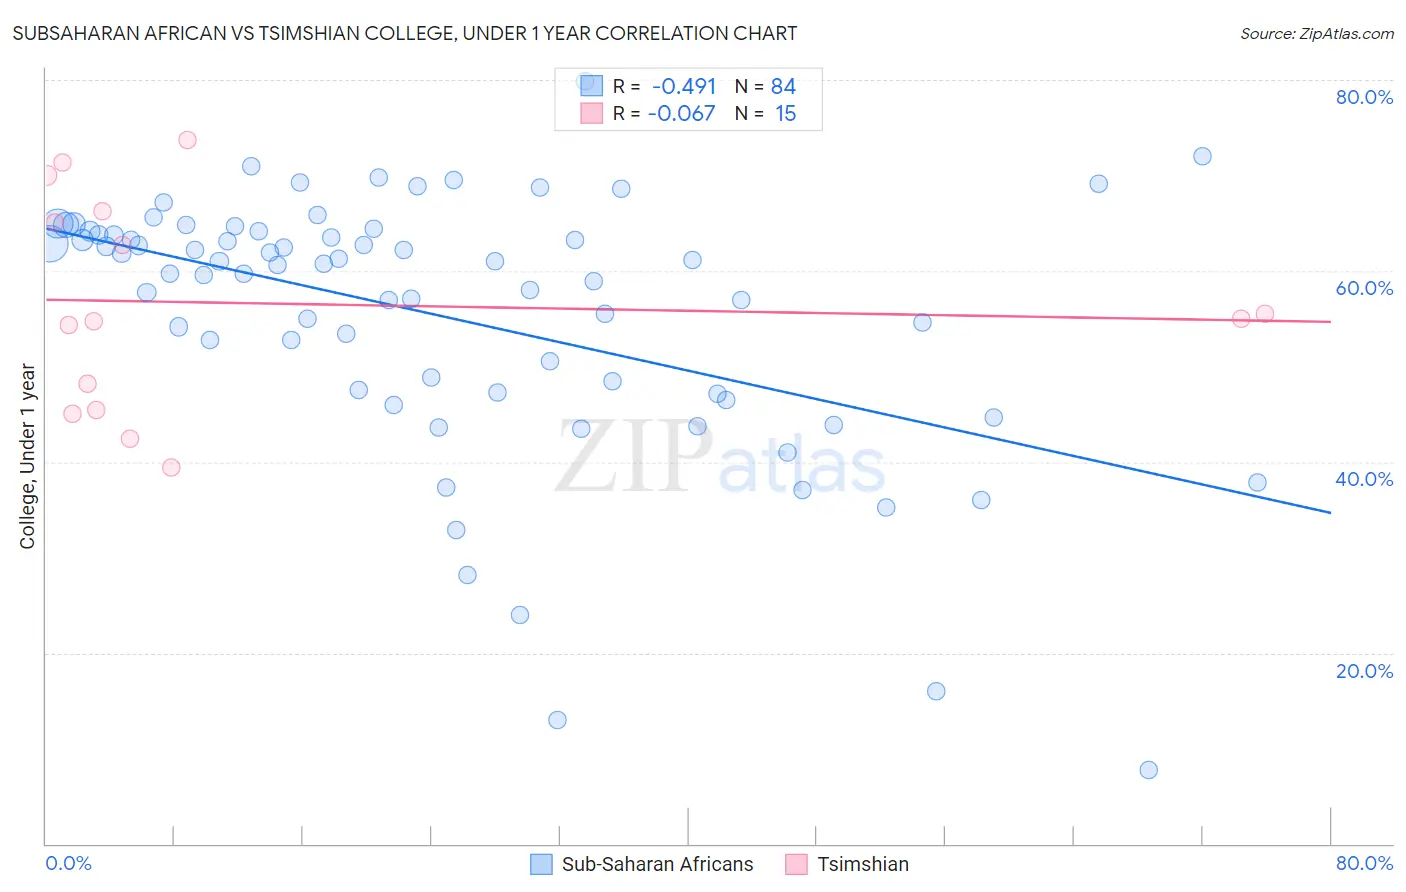
Subsaharan African vs Tsimshian College, Under 1 year Correlation Chart
The statistical analysis conducted on geographies consisting of 508,213,731 people shows a moderate negative correlation between the proportion of Sub-Saharan Africans and percentage of population with at least college, under 1 year education in the United States with a correlation coefficient (R) of -0.491 and weighted average of 63.2%. Similarly, the statistical analysis conducted on geographies consisting of 15,626,544 people shows a slight negative correlation between the proportion of Tsimshian and percentage of population with at least college, under 1 year education in the United States with a correlation coefficient (R) of -0.067 and weighted average of 64.3%, a difference of 1.8%.
College, Under 1 year Correlation Summary
| Measurement | Subsaharan African | Tsimshian |
| Minimum | 7.7% | 39.5% |
| Maximum | 79.8% | 73.8% |
| Range | 72.1% | 34.3% |
| Mean | 55.3% | 56.6% |
| Median | 60.7% | 54.9% |
| Interquartile 25% (IQ1) | 47.4% | 45.5% |
| Interquartile 75% (IQ3) | 63.9% | 66.2% |
| Interquartile Range (IQR) | 16.5% | 20.8% |
| Standard Deviation (Sample) | 13.7% | 11.1% |
| Standard Deviation (Population) | 13.6% | 10.7% |
Similar Demographics by College, Under 1 year
Demographics Similar to Sub-Saharan Africans by College, Under 1 year
In terms of college, under 1 year, the demographic groups most similar to Sub-Saharan Africans are Immigrants from Costa Rica (63.2%, a difference of 0.030%), Immigrants from Peru (63.1%, a difference of 0.10%), Immigrants from Colombia (63.1%, a difference of 0.12%), Immigrants from Senegal (63.3%, a difference of 0.15%), and Cree (63.3%, a difference of 0.20%).
| Demographics | Rating | Rank | College, Under 1 year |
| Immigrants | Uruguay | 5.8 /100 | #217 | Tragic 63.4% |
| Immigrants | Panama | 5.7 /100 | #218 | Tragic 63.4% |
| Immigrants | Fiji | 5.7 /100 | #219 | Tragic 63.4% |
| Portuguese | 5.6 /100 | #220 | Tragic 63.4% |
| Cree | 5.2 /100 | #221 | Tragic 63.3% |
| Immigrants | Senegal | 5.0 /100 | #222 | Tragic 63.3% |
| Immigrants | Costa Rica | 4.5 /100 | #223 | Tragic 63.2% |
| Sub-Saharan Africans | 4.4 /100 | #224 | Tragic 63.2% |
| Immigrants | Peru | 4.0 /100 | #225 | Tragic 63.1% |
| Immigrants | Colombia | 4.0 /100 | #226 | Tragic 63.1% |
| Immigrants | Ghana | 3.7 /100 | #227 | Tragic 63.1% |
| Samoans | 3.3 /100 | #228 | Tragic 63.0% |
| Liberians | 3.2 /100 | #229 | Tragic 63.0% |
| Immigrants | Nonimmigrants | 3.0 /100 | #230 | Tragic 62.9% |
| Immigrants | Western Africa | 2.4 /100 | #231 | Tragic 62.8% |
Demographics Similar to Tsimshian by College, Under 1 year
In terms of college, under 1 year, the demographic groups most similar to Tsimshian are Panamanian (64.3%, a difference of 0.070%), Nigerian (64.3%, a difference of 0.090%), Costa Rican (64.4%, a difference of 0.13%), French Canadian (64.2%, a difference of 0.13%), and South American (64.2%, a difference of 0.13%).
| Demographics | Rating | Rank | College, Under 1 year |
| Immigrants | Armenia | 28.1 /100 | #191 | Fair 64.7% |
| Immigrants | Thailand | 27.0 /100 | #192 | Fair 64.7% |
| Slovaks | 26.7 /100 | #193 | Fair 64.7% |
| Immigrants | Cameroon | 24.6 /100 | #194 | Fair 64.6% |
| Immigrants | South Eastern Asia | 22.1 /100 | #195 | Fair 64.5% |
| Tongans | 21.2 /100 | #196 | Fair 64.5% |
| Costa Ricans | 19.6 /100 | #197 | Poor 64.4% |
| Tsimshian | 17.9 /100 | #198 | Poor 64.3% |
| Panamanians | 17.0 /100 | #199 | Poor 64.3% |
| Nigerians | 16.7 /100 | #200 | Poor 64.3% |
| French Canadians | 16.3 /100 | #201 | Poor 64.2% |
| South Americans | 16.2 /100 | #202 | Poor 64.2% |
| Uruguayans | 15.6 /100 | #203 | Poor 64.2% |
| Immigrants | Zaire | 14.6 /100 | #204 | Poor 64.1% |
| Peruvians | 13.7 /100 | #205 | Poor 64.1% |