Shoshone vs Tsimshian High School Diploma
COMPARE
Shoshone
Tsimshian
High School Diploma
High School Diploma Comparison
Shoshone
Tsimshian
88.3%
HIGH SCHOOL DIPLOMA
7.0/ 100
METRIC RATING
224th/ 347
METRIC RANK
91.3%
HIGH SCHOOL DIPLOMA
99.9/ 100
METRIC RATING
36th/ 347
METRIC RANK
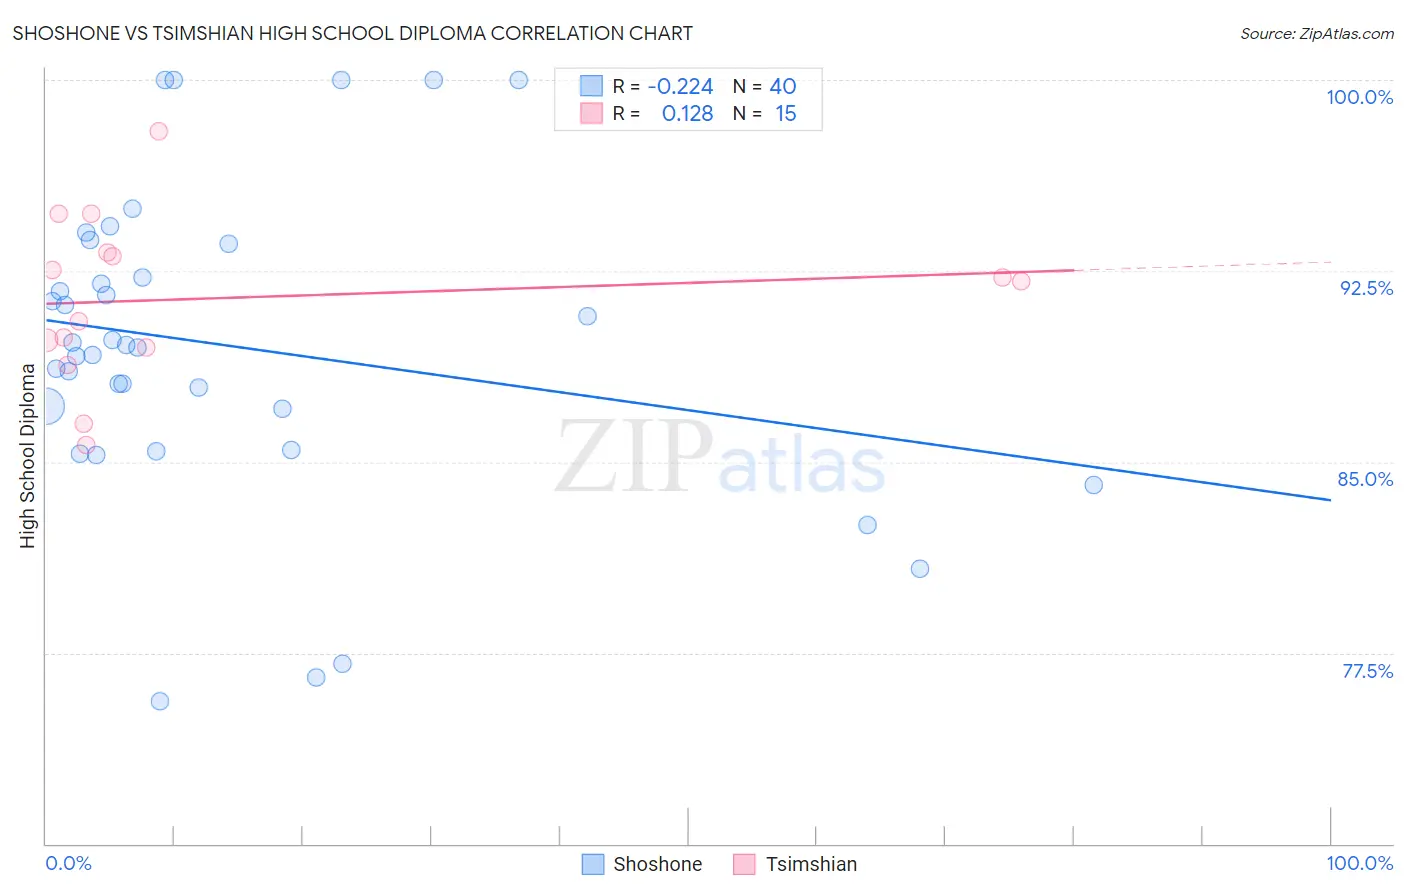
Shoshone vs Tsimshian High School Diploma Correlation Chart
The statistical analysis conducted on geographies consisting of 66,627,351 people shows a weak negative correlation between the proportion of Shoshone and percentage of population with at least high school diploma education in the United States with a correlation coefficient (R) of -0.224 and weighted average of 88.3%. Similarly, the statistical analysis conducted on geographies consisting of 15,626,544 people shows a poor positive correlation between the proportion of Tsimshian and percentage of population with at least high school diploma education in the United States with a correlation coefficient (R) of 0.128 and weighted average of 91.3%, a difference of 3.5%.
High School Diploma Correlation Summary
| Measurement | Shoshone | Tsimshian |
| Minimum | 75.6% | 85.7% |
| Maximum | 100.0% | 98.0% |
| Range | 24.4% | 12.3% |
| Mean | 89.5% | 91.4% |
| Median | 89.5% | 92.1% |
| Interquartile 25% (IQ1) | 86.3% | 89.5% |
| Interquartile 75% (IQ3) | 92.9% | 93.2% |
| Interquartile Range (IQR) | 6.6% | 3.8% |
| Standard Deviation (Sample) | 6.1% | 3.2% |
| Standard Deviation (Population) | 6.0% | 3.1% |
Similar Demographics by High School Diploma
Demographics Similar to Shoshone by High School Diploma
In terms of high school diploma, the demographic groups most similar to Shoshone are Creek (88.3%, a difference of 0.010%), Colville (88.3%, a difference of 0.040%), Immigrants from Zaire (88.3%, a difference of 0.040%), Immigrants from Afghanistan (88.3%, a difference of 0.090%), and Uruguayan (88.2%, a difference of 0.090%).
| Demographics | Rating | Rank | High School Diploma |
| Immigrants | Africa | 10.6 /100 | #217 | Poor 88.4% |
| Immigrants | Bolivia | 10.3 /100 | #218 | Poor 88.4% |
| Costa Ricans | 9.6 /100 | #219 | Tragic 88.4% |
| Tongans | 9.5 /100 | #220 | Tragic 88.4% |
| Immigrants | Afghanistan | 8.6 /100 | #221 | Tragic 88.3% |
| Colville | 7.8 /100 | #222 | Tragic 88.3% |
| Immigrants | Zaire | 7.6 /100 | #223 | Tragic 88.3% |
| Shoshone | 7.0 /100 | #224 | Tragic 88.3% |
| Creek | 6.9 /100 | #225 | Tragic 88.3% |
| Uruguayans | 5.6 /100 | #226 | Tragic 88.2% |
| Immigrants | Liberia | 5.5 /100 | #227 | Tragic 88.2% |
| Kiowa | 5.3 /100 | #228 | Tragic 88.2% |
| Nigerians | 5.2 /100 | #229 | Tragic 88.2% |
| Blackfeet | 4.2 /100 | #230 | Tragic 88.1% |
| Colombians | 3.8 /100 | #231 | Tragic 88.1% |
Demographics Similar to Tsimshian by High School Diploma
In terms of high school diploma, the demographic groups most similar to Tsimshian are Immigrants from Ireland (91.3%, a difference of 0.020%), Irish (91.4%, a difference of 0.030%), Immigrants from Scotland (91.3%, a difference of 0.040%), Dutch (91.3%, a difference of 0.050%), and Okinawan (91.4%, a difference of 0.060%).
| Demographics | Rating | Rank | High School Diploma |
| Europeans | 99.9 /100 | #29 | Exceptional 91.4% |
| Iranians | 99.9 /100 | #30 | Exceptional 91.4% |
| Immigrants | Northern Europe | 99.9 /100 | #31 | Exceptional 91.4% |
| English | 99.9 /100 | #32 | Exceptional 91.4% |
| Okinawans | 99.9 /100 | #33 | Exceptional 91.4% |
| Scottish | 99.9 /100 | #34 | Exceptional 91.4% |
| Irish | 99.9 /100 | #35 | Exceptional 91.4% |
| Tsimshian | 99.9 /100 | #36 | Exceptional 91.3% |
| Immigrants | Ireland | 99.9 /100 | #37 | Exceptional 91.3% |
| Immigrants | Scotland | 99.8 /100 | #38 | Exceptional 91.3% |
| Dutch | 99.8 /100 | #39 | Exceptional 91.3% |
| Immigrants | Lithuania | 99.8 /100 | #40 | Exceptional 91.3% |
| Immigrants | Australia | 99.8 /100 | #41 | Exceptional 91.3% |
| Northern Europeans | 99.8 /100 | #42 | Exceptional 91.3% |
| British | 99.8 /100 | #43 | Exceptional 91.3% |