Zimbabwean vs Immigrants from Turkey Associate's Degree
COMPARE
Zimbabwean
Immigrants from Turkey
Associate's Degree
Associate's Degree Comparison
Zimbabweans
Immigrants from Turkey
51.3%
ASSOCIATE'S DEGREE
99.7/ 100
METRIC RATING
65th/ 347
METRIC RANK
53.4%
ASSOCIATE'S DEGREE
100.0/ 100
METRIC RATING
32nd/ 347
METRIC RANK
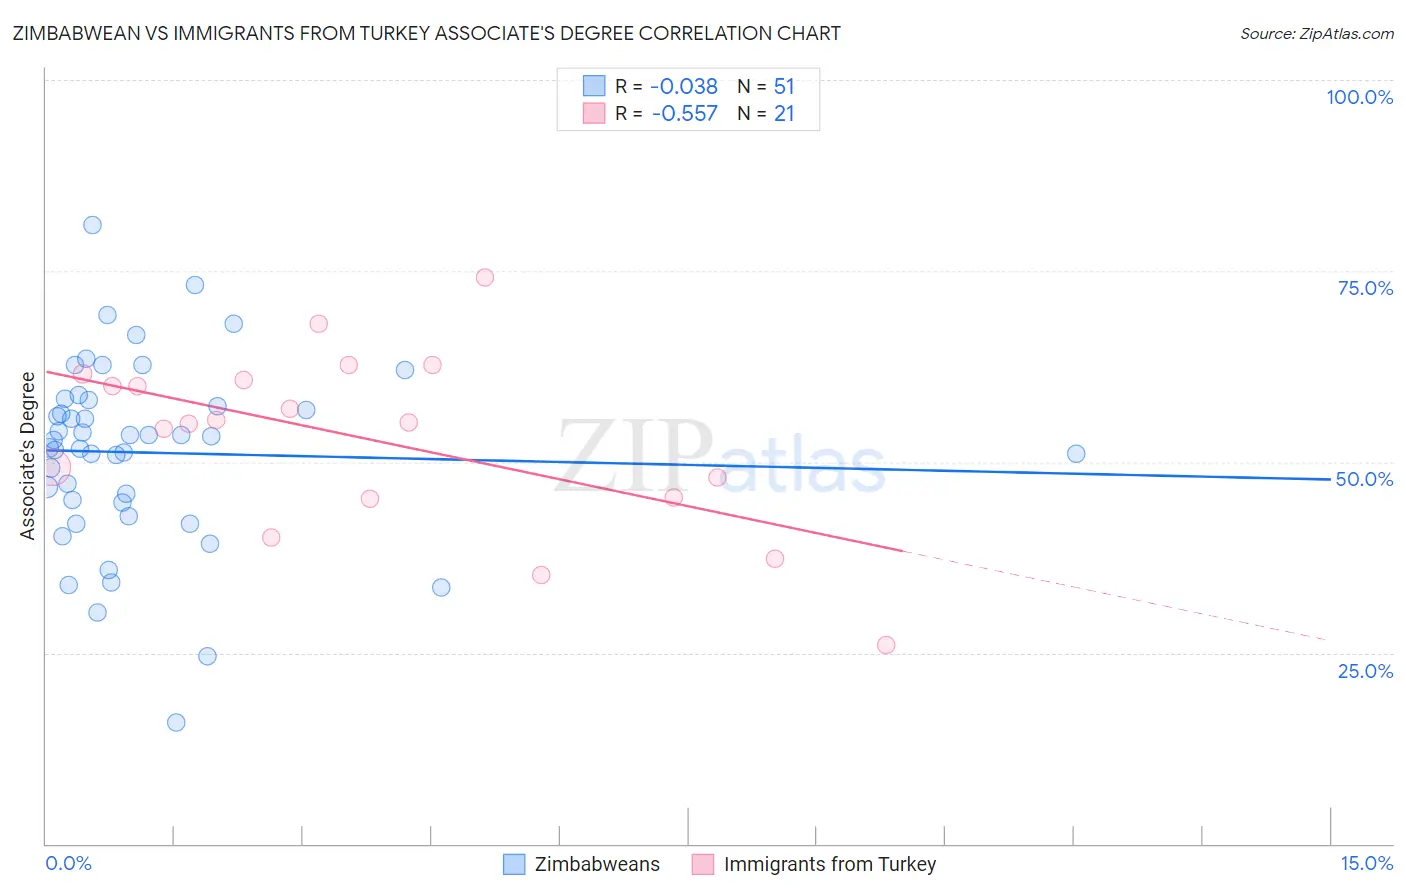
Zimbabwean vs Immigrants from Turkey Associate's Degree Correlation Chart
The statistical analysis conducted on geographies consisting of 69,203,423 people shows no correlation between the proportion of Zimbabweans and percentage of population with at least associate's degree education in the United States with a correlation coefficient (R) of -0.038 and weighted average of 51.3%. Similarly, the statistical analysis conducted on geographies consisting of 223,053,786 people shows a substantial negative correlation between the proportion of Immigrants from Turkey and percentage of population with at least associate's degree education in the United States with a correlation coefficient (R) of -0.557 and weighted average of 53.4%, a difference of 4.1%.
Associate's Degree Correlation Summary
| Measurement | Zimbabwean | Immigrants from Turkey |
| Minimum | 15.8% | 26.0% |
| Maximum | 81.0% | 74.2% |
| Range | 65.1% | 48.2% |
| Mean | 51.2% | 53.0% |
| Median | 52.9% | 55.2% |
| Interquartile 25% (IQ1) | 44.7% | 45.2% |
| Interquartile 75% (IQ3) | 58.2% | 61.1% |
| Interquartile Range (IQR) | 13.5% | 15.9% |
| Standard Deviation (Sample) | 12.2% | 11.7% |
| Standard Deviation (Population) | 12.1% | 11.4% |
Similar Demographics by Associate's Degree
Demographics Similar to Zimbabweans by Associate's Degree
In terms of associate's degree, the demographic groups most similar to Zimbabweans are Immigrants from Netherlands (51.4%, a difference of 0.030%), Immigrants from Europe (51.3%, a difference of 0.050%), South African (51.4%, a difference of 0.10%), Immigrants from Kazakhstan (51.4%, a difference of 0.16%), and Bhutanese (51.4%, a difference of 0.16%).
| Demographics | Rating | Rank | Associate's Degree |
| New Zealanders | 99.8 /100 | #58 | Exceptional 51.8% |
| Immigrants | Serbia | 99.8 /100 | #59 | Exceptional 51.7% |
| Immigrants | Bolivia | 99.7 /100 | #60 | Exceptional 51.5% |
| Immigrants | Kazakhstan | 99.7 /100 | #61 | Exceptional 51.4% |
| Bhutanese | 99.7 /100 | #62 | Exceptional 51.4% |
| South Africans | 99.7 /100 | #63 | Exceptional 51.4% |
| Immigrants | Netherlands | 99.7 /100 | #64 | Exceptional 51.4% |
| Zimbabweans | 99.7 /100 | #65 | Exceptional 51.3% |
| Immigrants | Europe | 99.7 /100 | #66 | Exceptional 51.3% |
| Argentineans | 99.6 /100 | #67 | Exceptional 51.2% |
| Immigrants | Indonesia | 99.5 /100 | #68 | Exceptional 51.0% |
| Egyptians | 99.5 /100 | #69 | Exceptional 50.9% |
| Immigrants | Argentina | 99.5 /100 | #70 | Exceptional 50.9% |
| Immigrants | Romania | 99.5 /100 | #71 | Exceptional 50.9% |
| Immigrants | Pakistan | 99.5 /100 | #72 | Exceptional 50.9% |
Demographics Similar to Immigrants from Turkey by Associate's Degree
In terms of associate's degree, the demographic groups most similar to Immigrants from Turkey are Immigrants from Northern Europe (53.5%, a difference of 0.030%), Israeli (53.4%, a difference of 0.12%), Bulgarian (53.3%, a difference of 0.31%), Russian (53.2%, a difference of 0.38%), and Immigrants from Sri Lanka (53.7%, a difference of 0.39%).
| Demographics | Rating | Rank | Associate's Degree |
| Immigrants | Switzerland | 100.0 /100 | #25 | Exceptional 54.5% |
| Immigrants | Belgium | 100.0 /100 | #26 | Exceptional 54.5% |
| Latvians | 100.0 /100 | #27 | Exceptional 53.9% |
| Turks | 100.0 /100 | #28 | Exceptional 53.9% |
| Immigrants | France | 100.0 /100 | #29 | Exceptional 53.9% |
| Immigrants | Sri Lanka | 100.0 /100 | #30 | Exceptional 53.7% |
| Immigrants | Northern Europe | 100.0 /100 | #31 | Exceptional 53.5% |
| Immigrants | Turkey | 100.0 /100 | #32 | Exceptional 53.4% |
| Israelis | 100.0 /100 | #33 | Exceptional 53.4% |
| Bulgarians | 100.0 /100 | #34 | Exceptional 53.3% |
| Russians | 100.0 /100 | #35 | Exceptional 53.2% |
| Immigrants | Russia | 100.0 /100 | #36 | Exceptional 53.1% |
| Immigrants | Denmark | 100.0 /100 | #37 | Exceptional 53.1% |
| Mongolians | 100.0 /100 | #38 | Exceptional 53.0% |
| Immigrants | Belarus | 99.9 /100 | #39 | Exceptional 52.8% |