Shoshone vs Malaysian Professional Degree
COMPARE
Shoshone
Malaysian
Professional Degree
Professional Degree Comparison
Shoshone
Malaysians
3.3%
PROFESSIONAL DEGREE
0.1/ 100
METRIC RATING
308th/ 347
METRIC RANK
3.4%
PROFESSIONAL DEGREE
0.2/ 100
METRIC RATING
302nd/ 347
METRIC RANK
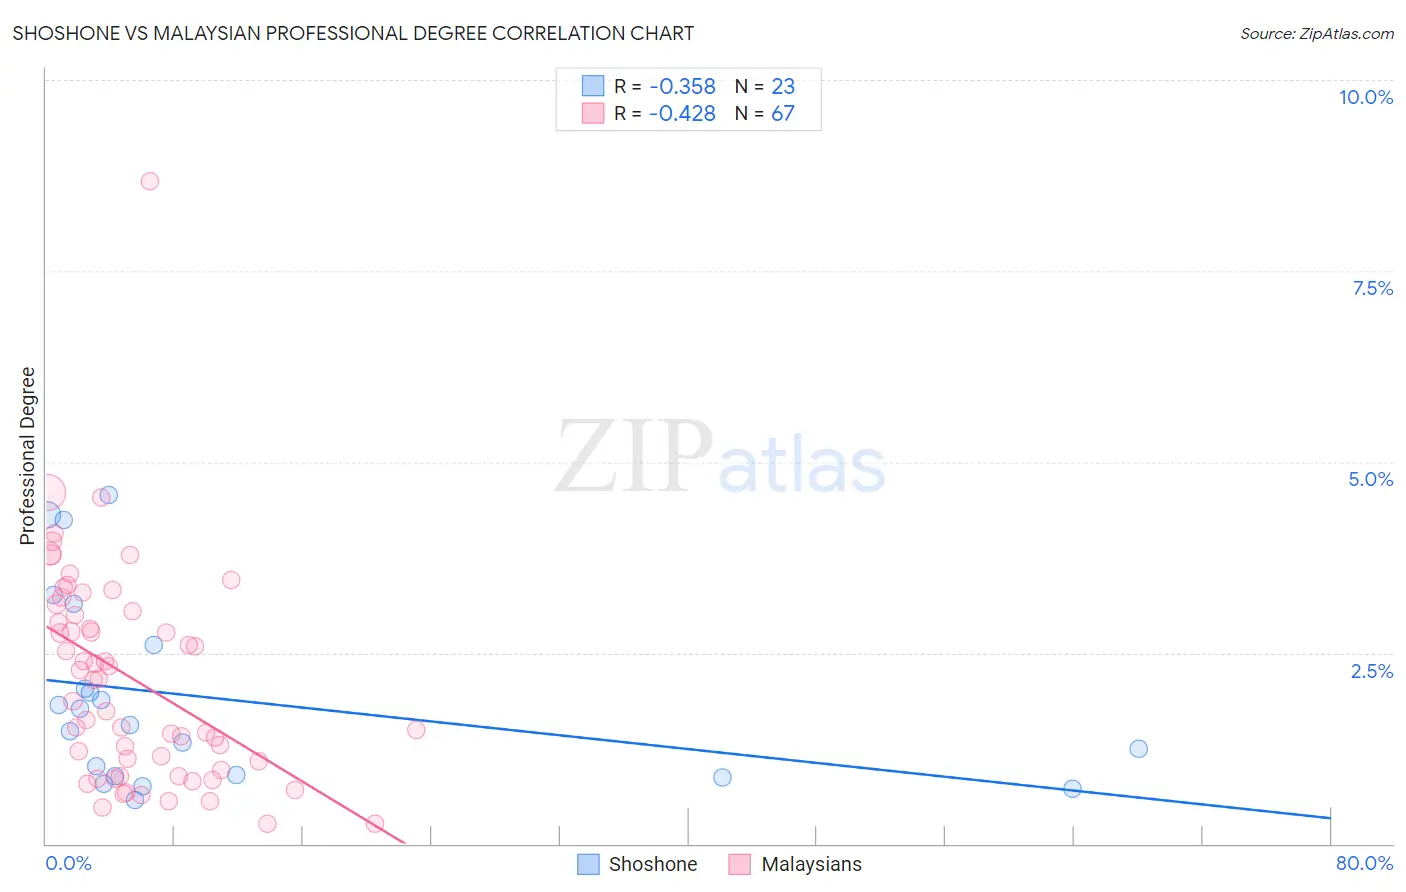
Shoshone vs Malaysian Professional Degree Correlation Chart
The statistical analysis conducted on geographies consisting of 66,513,785 people shows a mild negative correlation between the proportion of Shoshone and percentage of population with at least professional degree education in the United States with a correlation coefficient (R) of -0.358 and weighted average of 3.3%. Similarly, the statistical analysis conducted on geographies consisting of 225,764,269 people shows a moderate negative correlation between the proportion of Malaysians and percentage of population with at least professional degree education in the United States with a correlation coefficient (R) of -0.428 and weighted average of 3.4%, a difference of 2.6%.
Professional Degree Correlation Summary
| Measurement | Shoshone | Malaysian |
| Minimum | 0.57% | 0.26% |
| Maximum | 4.6% | 8.7% |
| Range | 4.0% | 8.4% |
| Mean | 1.9% | 2.2% |
| Median | 1.6% | 2.1% |
| Interquartile 25% (IQ1) | 0.89% | 0.97% |
| Interquartile 75% (IQ3) | 2.6% | 3.1% |
| Interquartile Range (IQR) | 1.7% | 2.1% |
| Standard Deviation (Sample) | 1.2% | 1.4% |
| Standard Deviation (Population) | 1.2% | 1.4% |
Demographics Similar to Shoshone and Malaysians by Professional Degree
In terms of professional degree, the demographic groups most similar to Shoshone are Pima (3.3%, a difference of 0.010%), Immigrants from Latin America (3.3%, a difference of 0.33%), Cherokee (3.3%, a difference of 0.48%), Samoan (3.3%, a difference of 0.50%), and Sioux (3.3%, a difference of 1.1%). Similarly, the demographic groups most similar to Malaysians are Immigrants from Dominican Republic (3.4%, a difference of 0.11%), Black/African American (3.4%, a difference of 0.25%), Immigrants from Yemen (3.4%, a difference of 0.38%), Immigrants from Haiti (3.4%, a difference of 0.66%), and Cajun (3.4%, a difference of 0.66%).
| Demographics | Rating | Rank | Professional Degree |
| Immigrants | Guatemala | 0.2 /100 | #295 | Tragic 3.4% |
| Hawaiians | 0.2 /100 | #296 | Tragic 3.4% |
| Immigrants | Liberia | 0.2 /100 | #297 | Tragic 3.4% |
| Ottawa | 0.2 /100 | #298 | Tragic 3.4% |
| Immigrants | Yemen | 0.2 /100 | #299 | Tragic 3.4% |
| Blacks/African Americans | 0.2 /100 | #300 | Tragic 3.4% |
| Immigrants | Dominican Republic | 0.2 /100 | #301 | Tragic 3.4% |
| Malaysians | 0.2 /100 | #302 | Tragic 3.4% |
| Immigrants | Haiti | 0.2 /100 | #303 | Tragic 3.4% |
| Cajuns | 0.2 /100 | #304 | Tragic 3.4% |
| Chickasaw | 0.1 /100 | #305 | Tragic 3.4% |
| Cape Verdeans | 0.1 /100 | #306 | Tragic 3.4% |
| Samoans | 0.1 /100 | #307 | Tragic 3.3% |
| Shoshone | 0.1 /100 | #308 | Tragic 3.3% |
| Pima | 0.1 /100 | #309 | Tragic 3.3% |
| Immigrants | Latin America | 0.1 /100 | #310 | Tragic 3.3% |
| Cherokee | 0.1 /100 | #311 | Tragic 3.3% |
| Sioux | 0.1 /100 | #312 | Tragic 3.3% |
| Yuman | 0.1 /100 | #313 | Tragic 3.3% |
| Mexican American Indians | 0.1 /100 | #314 | Tragic 3.3% |
| Immigrants | Laos | 0.1 /100 | #315 | Tragic 3.2% |