Shoshone vs Irish Professional Degree
COMPARE
Shoshone
Irish
Professional Degree
Professional Degree Comparison
Shoshone
Irish
3.3%
PROFESSIONAL DEGREE
0.1/ 100
METRIC RATING
308th/ 347
METRIC RANK
4.4%
PROFESSIONAL DEGREE
50.0/ 100
METRIC RATING
175th/ 347
METRIC RANK
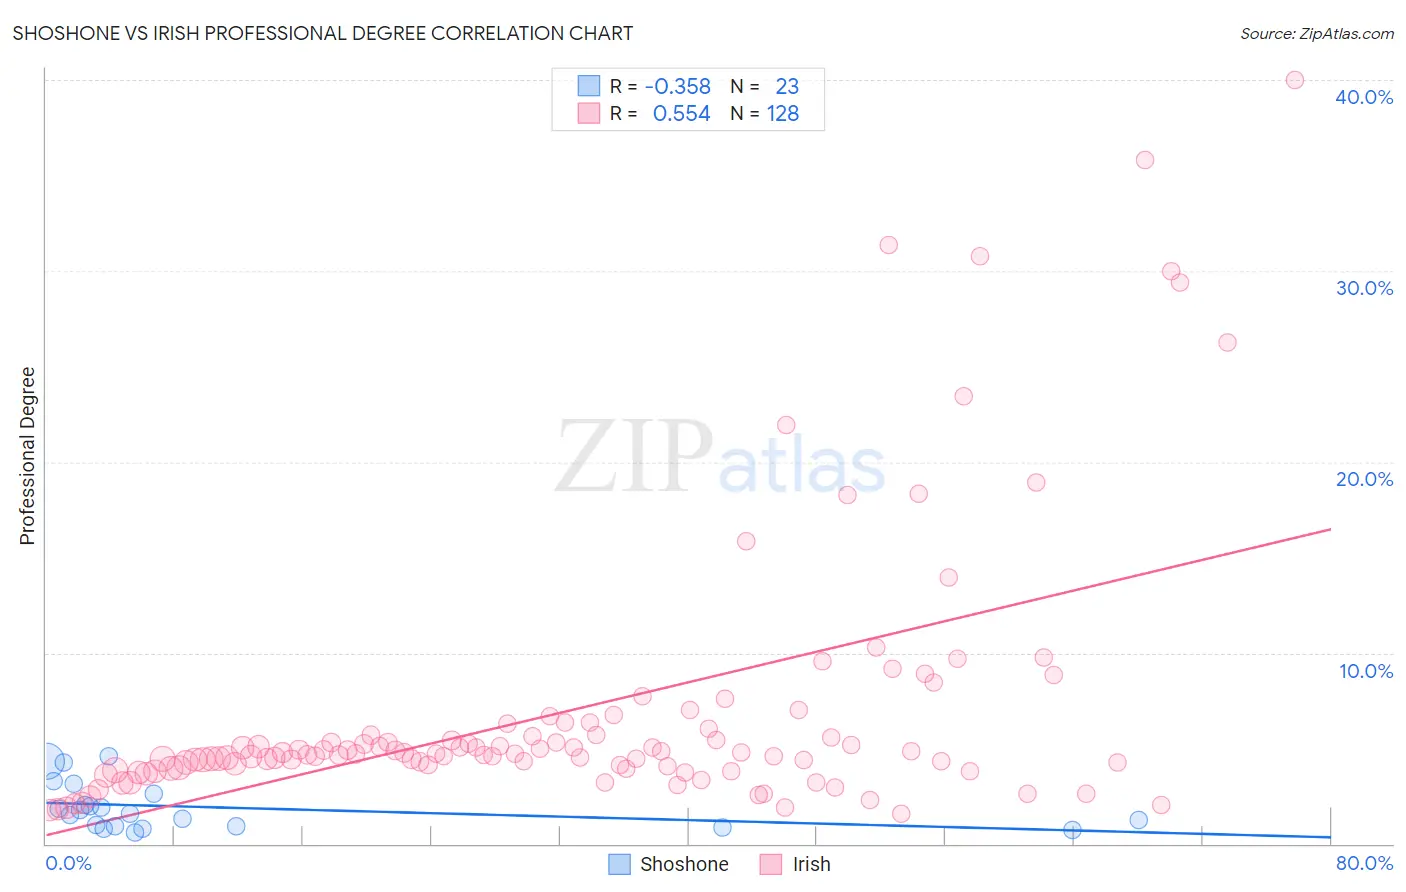
Shoshone vs Irish Professional Degree Correlation Chart
The statistical analysis conducted on geographies consisting of 66,513,785 people shows a mild negative correlation between the proportion of Shoshone and percentage of population with at least professional degree education in the United States with a correlation coefficient (R) of -0.358 and weighted average of 3.3%. Similarly, the statistical analysis conducted on geographies consisting of 569,237,980 people shows a substantial positive correlation between the proportion of Irish and percentage of population with at least professional degree education in the United States with a correlation coefficient (R) of 0.554 and weighted average of 4.4%, a difference of 33.2%.
Professional Degree Correlation Summary
| Measurement | Shoshone | Irish |
| Minimum | 0.57% | 1.5% |
| Maximum | 4.6% | 40.0% |
| Range | 4.0% | 38.5% |
| Mean | 1.9% | 7.0% |
| Median | 1.6% | 4.7% |
| Interquartile 25% (IQ1) | 0.89% | 4.0% |
| Interquartile 75% (IQ3) | 2.6% | 5.9% |
| Interquartile Range (IQR) | 1.7% | 1.9% |
| Standard Deviation (Sample) | 1.2% | 7.1% |
| Standard Deviation (Population) | 1.2% | 7.1% |
Similar Demographics by Professional Degree
Demographics Similar to Shoshone by Professional Degree
In terms of professional degree, the demographic groups most similar to Shoshone are Pima (3.3%, a difference of 0.010%), Immigrants from Latin America (3.3%, a difference of 0.33%), Cherokee (3.3%, a difference of 0.48%), Samoan (3.3%, a difference of 0.50%), and Sioux (3.3%, a difference of 1.1%).
| Demographics | Rating | Rank | Professional Degree |
| Immigrants | Dominican Republic | 0.2 /100 | #301 | Tragic 3.4% |
| Malaysians | 0.2 /100 | #302 | Tragic 3.4% |
| Immigrants | Haiti | 0.2 /100 | #303 | Tragic 3.4% |
| Cajuns | 0.2 /100 | #304 | Tragic 3.4% |
| Chickasaw | 0.1 /100 | #305 | Tragic 3.4% |
| Cape Verdeans | 0.1 /100 | #306 | Tragic 3.4% |
| Samoans | 0.1 /100 | #307 | Tragic 3.3% |
| Shoshone | 0.1 /100 | #308 | Tragic 3.3% |
| Pima | 0.1 /100 | #309 | Tragic 3.3% |
| Immigrants | Latin America | 0.1 /100 | #310 | Tragic 3.3% |
| Cherokee | 0.1 /100 | #311 | Tragic 3.3% |
| Sioux | 0.1 /100 | #312 | Tragic 3.3% |
| Yuman | 0.1 /100 | #313 | Tragic 3.3% |
| Mexican American Indians | 0.1 /100 | #314 | Tragic 3.3% |
| Immigrants | Laos | 0.1 /100 | #315 | Tragic 3.2% |
Demographics Similar to Irish by Professional Degree
In terms of professional degree, the demographic groups most similar to Irish are Kenyan (4.4%, a difference of 0.0%), English (4.4%, a difference of 0.020%), Immigrants from Peru (4.4%, a difference of 0.10%), Spaniard (4.4%, a difference of 0.30%), and Celtic (4.4%, a difference of 0.35%).
| Demographics | Rating | Rank | Professional Degree |
| Immigrants | Sierra Leone | 58.7 /100 | #168 | Average 4.5% |
| Chinese | 58.6 /100 | #169 | Average 4.5% |
| Immigrants | Zaire | 57.4 /100 | #170 | Average 4.5% |
| Immigrants | Bangladesh | 56.0 /100 | #171 | Average 4.4% |
| Spaniards | 52.0 /100 | #172 | Average 4.4% |
| English | 50.1 /100 | #173 | Average 4.4% |
| Kenyans | 50.0 /100 | #174 | Average 4.4% |
| Irish | 50.0 /100 | #175 | Average 4.4% |
| Immigrants | Peru | 49.3 /100 | #176 | Average 4.4% |
| Celtics | 47.6 /100 | #177 | Average 4.4% |
| Immigrants | Costa Rica | 46.7 /100 | #178 | Average 4.4% |
| Immigrants | Kenya | 45.9 /100 | #179 | Average 4.4% |
| Czechs | 44.9 /100 | #180 | Average 4.4% |
| Danes | 43.5 /100 | #181 | Average 4.4% |
| Immigrants | Immigrants | 43.2 /100 | #182 | Average 4.4% |