Shoshone vs Immigrants from Malaysia Professional Degree
COMPARE
Shoshone
Immigrants from Malaysia
Professional Degree
Professional Degree Comparison
Shoshone
Immigrants from Malaysia
3.3%
PROFESSIONAL DEGREE
0.1/ 100
METRIC RATING
308th/ 347
METRIC RANK
5.7%
PROFESSIONAL DEGREE
100.0/ 100
METRIC RATING
56th/ 347
METRIC RANK
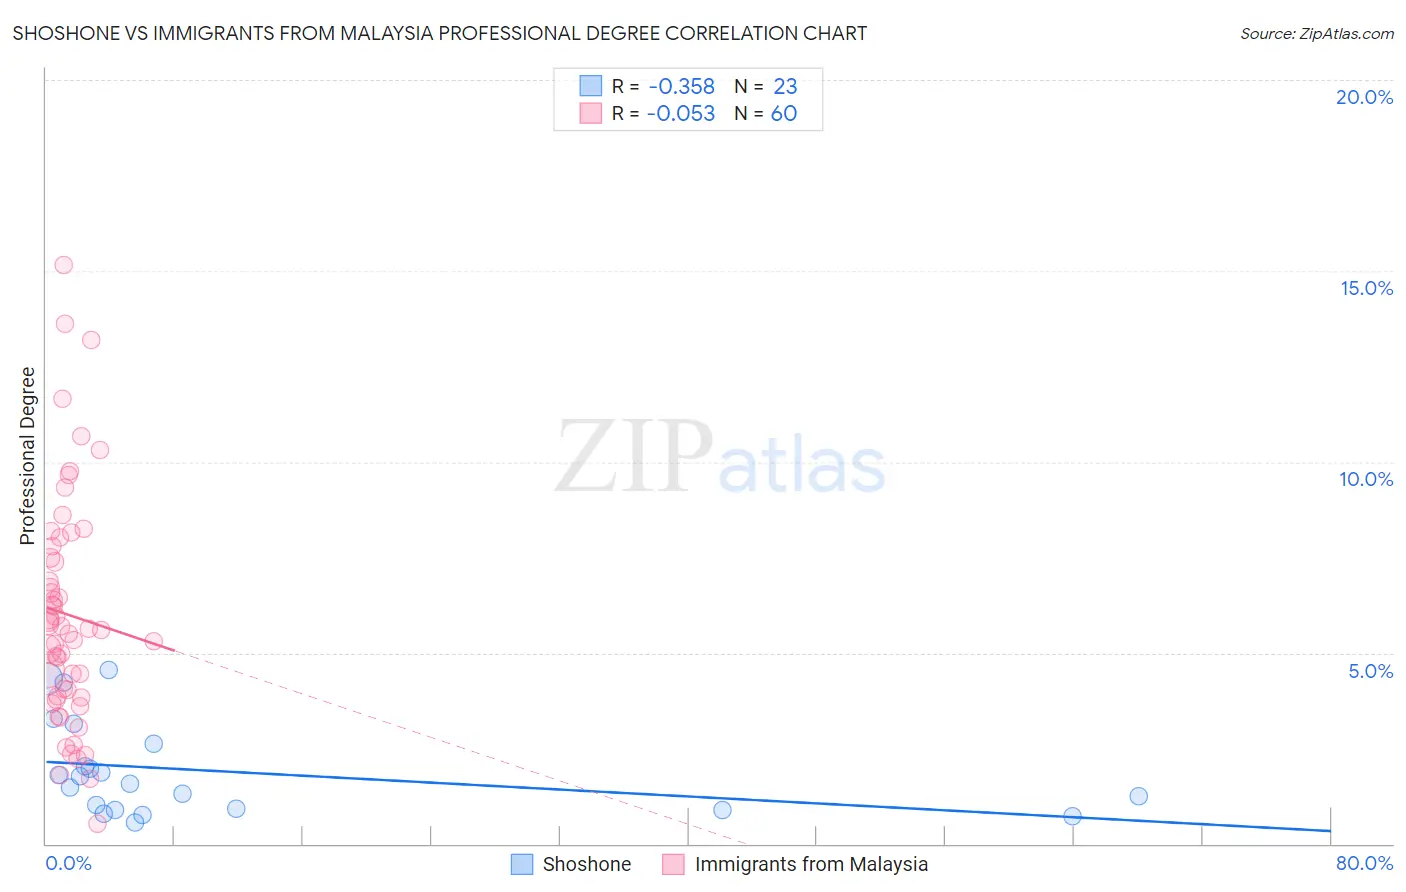
Shoshone vs Immigrants from Malaysia Professional Degree Correlation Chart
The statistical analysis conducted on geographies consisting of 66,513,785 people shows a mild negative correlation between the proportion of Shoshone and percentage of population with at least professional degree education in the United States with a correlation coefficient (R) of -0.358 and weighted average of 3.3%. Similarly, the statistical analysis conducted on geographies consisting of 197,901,227 people shows a slight negative correlation between the proportion of Immigrants from Malaysia and percentage of population with at least professional degree education in the United States with a correlation coefficient (R) of -0.053 and weighted average of 5.7%, a difference of 72.6%.
Professional Degree Correlation Summary
| Measurement | Shoshone | Immigrants from Malaysia |
| Minimum | 0.57% | 0.51% |
| Maximum | 4.6% | 15.2% |
| Range | 4.0% | 14.6% |
| Mean | 1.9% | 6.0% |
| Median | 1.6% | 5.6% |
| Interquartile 25% (IQ1) | 0.89% | 3.8% |
| Interquartile 75% (IQ3) | 2.6% | 7.6% |
| Interquartile Range (IQR) | 1.7% | 3.8% |
| Standard Deviation (Sample) | 1.2% | 3.0% |
| Standard Deviation (Population) | 1.2% | 3.0% |
Similar Demographics by Professional Degree
Demographics Similar to Shoshone by Professional Degree
In terms of professional degree, the demographic groups most similar to Shoshone are Pima (3.3%, a difference of 0.010%), Immigrants from Latin America (3.3%, a difference of 0.33%), Cherokee (3.3%, a difference of 0.48%), Samoan (3.3%, a difference of 0.50%), and Sioux (3.3%, a difference of 1.1%).
| Demographics | Rating | Rank | Professional Degree |
| Immigrants | Dominican Republic | 0.2 /100 | #301 | Tragic 3.4% |
| Malaysians | 0.2 /100 | #302 | Tragic 3.4% |
| Immigrants | Haiti | 0.2 /100 | #303 | Tragic 3.4% |
| Cajuns | 0.2 /100 | #304 | Tragic 3.4% |
| Chickasaw | 0.1 /100 | #305 | Tragic 3.4% |
| Cape Verdeans | 0.1 /100 | #306 | Tragic 3.4% |
| Samoans | 0.1 /100 | #307 | Tragic 3.3% |
| Shoshone | 0.1 /100 | #308 | Tragic 3.3% |
| Pima | 0.1 /100 | #309 | Tragic 3.3% |
| Immigrants | Latin America | 0.1 /100 | #310 | Tragic 3.3% |
| Cherokee | 0.1 /100 | #311 | Tragic 3.3% |
| Sioux | 0.1 /100 | #312 | Tragic 3.3% |
| Yuman | 0.1 /100 | #313 | Tragic 3.3% |
| Mexican American Indians | 0.1 /100 | #314 | Tragic 3.3% |
| Immigrants | Laos | 0.1 /100 | #315 | Tragic 3.2% |
Demographics Similar to Immigrants from Malaysia by Professional Degree
In terms of professional degree, the demographic groups most similar to Immigrants from Malaysia are Immigrants from Western Europe (5.7%, a difference of 0.12%), South African (5.7%, a difference of 0.26%), Immigrants from Kuwait (5.7%, a difference of 0.52%), Bulgarian (5.7%, a difference of 0.86%), and Immigrants from Europe (5.6%, a difference of 1.4%).
| Demographics | Rating | Rank | Professional Degree |
| Immigrants | Latvia | 100.0 /100 | #49 | Exceptional 5.8% |
| Immigrants | Czechoslovakia | 100.0 /100 | #50 | Exceptional 5.8% |
| Immigrants | Greece | 100.0 /100 | #51 | Exceptional 5.8% |
| Immigrants | Serbia | 100.0 /100 | #52 | Exceptional 5.8% |
| Immigrants | Netherlands | 100.0 /100 | #53 | Exceptional 5.8% |
| Immigrants | Kuwait | 100.0 /100 | #54 | Exceptional 5.7% |
| Immigrants | Western Europe | 100.0 /100 | #55 | Exceptional 5.7% |
| Immigrants | Malaysia | 100.0 /100 | #56 | Exceptional 5.7% |
| South Africans | 100.0 /100 | #57 | Exceptional 5.7% |
| Bulgarians | 100.0 /100 | #58 | Exceptional 5.7% |
| Immigrants | Europe | 100.0 /100 | #59 | Exceptional 5.6% |
| Bolivians | 99.9 /100 | #60 | Exceptional 5.6% |
| Immigrants | Lithuania | 99.9 /100 | #61 | Exceptional 5.6% |
| Immigrants | Belarus | 99.9 /100 | #62 | Exceptional 5.5% |
| Asians | 99.9 /100 | #63 | Exceptional 5.5% |