Shoshone vs Scottish Professional Degree
COMPARE
Shoshone
Scottish
Professional Degree
Professional Degree Comparison
Shoshone
Scottish
3.3%
PROFESSIONAL DEGREE
0.1/ 100
METRIC RATING
308th/ 347
METRIC RANK
4.6%
PROFESSIONAL DEGREE
71.8/ 100
METRIC RATING
154th/ 347
METRIC RANK
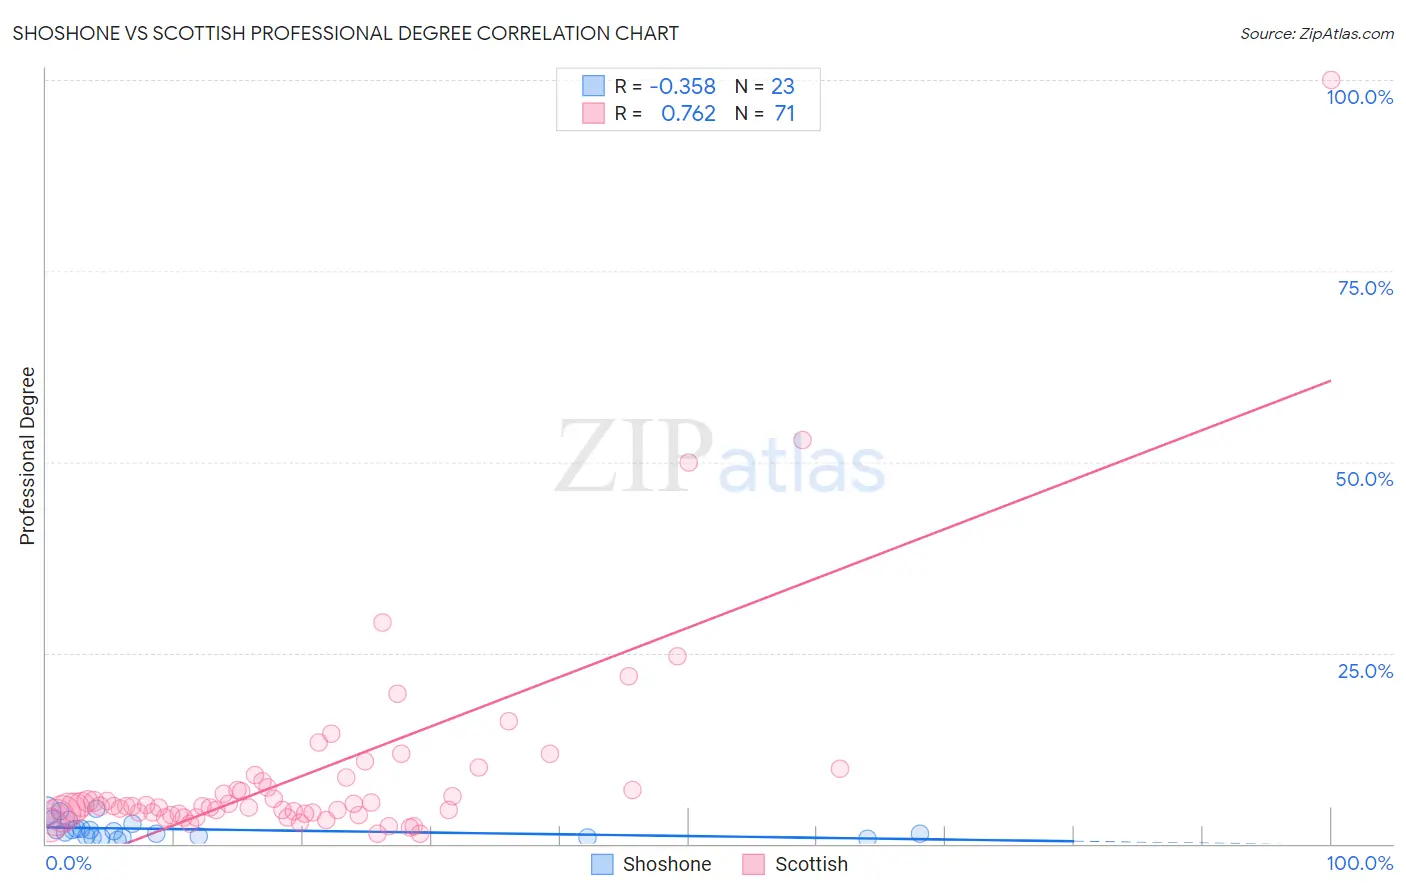
Shoshone vs Scottish Professional Degree Correlation Chart
The statistical analysis conducted on geographies consisting of 66,513,785 people shows a mild negative correlation between the proportion of Shoshone and percentage of population with at least professional degree education in the United States with a correlation coefficient (R) of -0.358 and weighted average of 3.3%. Similarly, the statistical analysis conducted on geographies consisting of 558,904,242 people shows a strong positive correlation between the proportion of Scottish and percentage of population with at least professional degree education in the United States with a correlation coefficient (R) of 0.762 and weighted average of 4.6%, a difference of 37.7%.
Professional Degree Correlation Summary
| Measurement | Shoshone | Scottish |
| Minimum | 0.57% | 1.3% |
| Maximum | 4.6% | 100.0% |
| Range | 4.0% | 98.7% |
| Mean | 1.9% | 9.2% |
| Median | 1.6% | 4.9% |
| Interquartile 25% (IQ1) | 0.89% | 4.0% |
| Interquartile 75% (IQ3) | 2.6% | 8.2% |
| Interquartile Range (IQR) | 1.7% | 4.2% |
| Standard Deviation (Sample) | 1.2% | 14.2% |
| Standard Deviation (Population) | 1.2% | 14.1% |
Similar Demographics by Professional Degree
Demographics Similar to Shoshone by Professional Degree
In terms of professional degree, the demographic groups most similar to Shoshone are Pima (3.3%, a difference of 0.010%), Immigrants from Latin America (3.3%, a difference of 0.33%), Cherokee (3.3%, a difference of 0.48%), Samoan (3.3%, a difference of 0.50%), and Sioux (3.3%, a difference of 1.1%).
| Demographics | Rating | Rank | Professional Degree |
| Immigrants | Dominican Republic | 0.2 /100 | #301 | Tragic 3.4% |
| Malaysians | 0.2 /100 | #302 | Tragic 3.4% |
| Immigrants | Haiti | 0.2 /100 | #303 | Tragic 3.4% |
| Cajuns | 0.2 /100 | #304 | Tragic 3.4% |
| Chickasaw | 0.1 /100 | #305 | Tragic 3.4% |
| Cape Verdeans | 0.1 /100 | #306 | Tragic 3.4% |
| Samoans | 0.1 /100 | #307 | Tragic 3.3% |
| Shoshone | 0.1 /100 | #308 | Tragic 3.3% |
| Pima | 0.1 /100 | #309 | Tragic 3.3% |
| Immigrants | Latin America | 0.1 /100 | #310 | Tragic 3.3% |
| Cherokee | 0.1 /100 | #311 | Tragic 3.3% |
| Sioux | 0.1 /100 | #312 | Tragic 3.3% |
| Yuman | 0.1 /100 | #313 | Tragic 3.3% |
| Mexican American Indians | 0.1 /100 | #314 | Tragic 3.3% |
| Immigrants | Laos | 0.1 /100 | #315 | Tragic 3.2% |
Demographics Similar to Scottish by Professional Degree
In terms of professional degree, the demographic groups most similar to Scottish are Immigrants from Africa (4.6%, a difference of 0.12%), Immigrants from Uruguay (4.6%, a difference of 0.12%), Polish (4.6%, a difference of 0.14%), Slavic (4.5%, a difference of 0.18%), and Immigrants from Oceania (4.6%, a difference of 0.28%).
| Demographics | Rating | Rank | Professional Degree |
| Colombians | 77.7 /100 | #147 | Good 4.6% |
| Slovenes | 76.1 /100 | #148 | Good 4.6% |
| Senegalese | 75.3 /100 | #149 | Good 4.6% |
| Immigrants | Oceania | 73.4 /100 | #150 | Good 4.6% |
| Poles | 72.6 /100 | #151 | Good 4.6% |
| Immigrants | Africa | 72.5 /100 | #152 | Good 4.6% |
| Immigrants | Uruguay | 72.5 /100 | #153 | Good 4.6% |
| Scottish | 71.8 /100 | #154 | Good 4.6% |
| Slavs | 70.8 /100 | #155 | Good 4.5% |
| Swedes | 69.9 /100 | #156 | Good 4.5% |
| Iraqis | 69.8 /100 | #157 | Good 4.5% |
| Immigrants | Armenia | 68.8 /100 | #158 | Good 4.5% |
| Vietnamese | 68.4 /100 | #159 | Good 4.5% |
| Immigrants | Senegal | 68.0 /100 | #160 | Good 4.5% |
| Assyrians/Chaldeans/Syriacs | 67.4 /100 | #161 | Good 4.5% |