Immigrants from Switzerland vs Subsaharan African College, Under 1 year
COMPARE
Immigrants from Switzerland
Subsaharan African
College, Under 1 year
College, Under 1 year Comparison
Immigrants from Switzerland
Sub-Saharan Africans
71.7%
COLLEGE, UNDER 1 YEAR
100.0/ 100
METRIC RATING
18th/ 347
METRIC RANK
63.2%
COLLEGE, UNDER 1 YEAR
4.4/ 100
METRIC RATING
224th/ 347
METRIC RANK
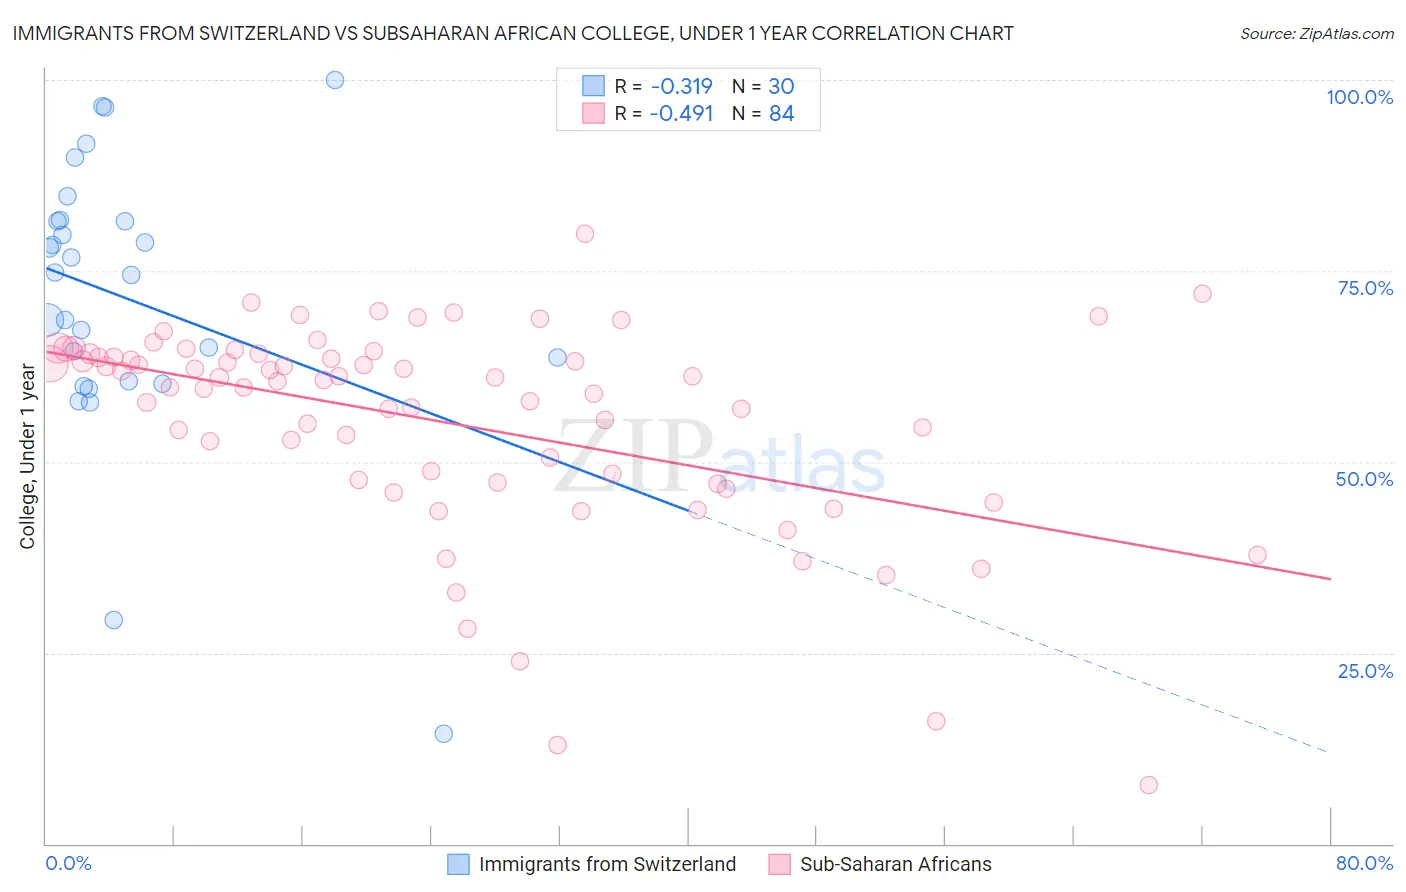
Immigrants from Switzerland vs Subsaharan African College, Under 1 year Correlation Chart
The statistical analysis conducted on geographies consisting of 148,083,583 people shows a mild negative correlation between the proportion of Immigrants from Switzerland and percentage of population with at least college, under 1 year education in the United States with a correlation coefficient (R) of -0.319 and weighted average of 71.7%. Similarly, the statistical analysis conducted on geographies consisting of 508,213,731 people shows a moderate negative correlation between the proportion of Sub-Saharan Africans and percentage of population with at least college, under 1 year education in the United States with a correlation coefficient (R) of -0.491 and weighted average of 63.2%, a difference of 13.4%.
College, Under 1 year Correlation Summary
| Measurement | Immigrants from Switzerland | Subsaharan African |
| Minimum | 14.4% | 7.7% |
| Maximum | 100.0% | 79.8% |
| Range | 85.6% | 72.1% |
| Mean | 71.4% | 55.3% |
| Median | 74.6% | 60.7% |
| Interquartile 25% (IQ1) | 60.6% | 47.4% |
| Interquartile 75% (IQ3) | 81.5% | 63.9% |
| Interquartile Range (IQR) | 20.9% | 16.5% |
| Standard Deviation (Sample) | 18.2% | 13.7% |
| Standard Deviation (Population) | 17.9% | 13.6% |
Similar Demographics by College, Under 1 year
Demographics Similar to Immigrants from Switzerland by College, Under 1 year
In terms of college, under 1 year, the demographic groups most similar to Immigrants from Switzerland are Latvian (71.6%, a difference of 0.11%), Eastern European (71.8%, a difference of 0.13%), Immigrants from Korea (71.6%, a difference of 0.15%), Immigrants from Japan (71.9%, a difference of 0.28%), and Cambodian (71.9%, a difference of 0.29%).
| Demographics | Rating | Rank | College, Under 1 year |
| Immigrants | South Central Asia | 100.0 /100 | #11 | Exceptional 72.1% |
| Immigrants | Sweden | 100.0 /100 | #12 | Exceptional 72.1% |
| Cypriots | 100.0 /100 | #13 | Exceptional 72.0% |
| Cambodians | 100.0 /100 | #14 | Exceptional 71.9% |
| Burmese | 100.0 /100 | #15 | Exceptional 71.9% |
| Immigrants | Japan | 100.0 /100 | #16 | Exceptional 71.9% |
| Eastern Europeans | 100.0 /100 | #17 | Exceptional 71.8% |
| Immigrants | Switzerland | 100.0 /100 | #18 | Exceptional 71.7% |
| Latvians | 100.0 /100 | #19 | Exceptional 71.6% |
| Immigrants | Korea | 100.0 /100 | #20 | Exceptional 71.6% |
| Immigrants | Belgium | 100.0 /100 | #21 | Exceptional 71.5% |
| Immigrants | Eastern Asia | 100.0 /100 | #22 | Exceptional 71.3% |
| Immigrants | Northern Europe | 100.0 /100 | #23 | Exceptional 71.1% |
| Soviet Union | 100.0 /100 | #24 | Exceptional 71.1% |
| Bulgarians | 100.0 /100 | #25 | Exceptional 71.1% |
Demographics Similar to Sub-Saharan Africans by College, Under 1 year
In terms of college, under 1 year, the demographic groups most similar to Sub-Saharan Africans are Immigrants from Costa Rica (63.2%, a difference of 0.030%), Immigrants from Peru (63.1%, a difference of 0.10%), Immigrants from Colombia (63.1%, a difference of 0.12%), Immigrants from Senegal (63.3%, a difference of 0.15%), and Cree (63.3%, a difference of 0.20%).
| Demographics | Rating | Rank | College, Under 1 year |
| Immigrants | Uruguay | 5.8 /100 | #217 | Tragic 63.4% |
| Immigrants | Panama | 5.7 /100 | #218 | Tragic 63.4% |
| Immigrants | Fiji | 5.7 /100 | #219 | Tragic 63.4% |
| Portuguese | 5.6 /100 | #220 | Tragic 63.4% |
| Cree | 5.2 /100 | #221 | Tragic 63.3% |
| Immigrants | Senegal | 5.0 /100 | #222 | Tragic 63.3% |
| Immigrants | Costa Rica | 4.5 /100 | #223 | Tragic 63.2% |
| Sub-Saharan Africans | 4.4 /100 | #224 | Tragic 63.2% |
| Immigrants | Peru | 4.0 /100 | #225 | Tragic 63.1% |
| Immigrants | Colombia | 4.0 /100 | #226 | Tragic 63.1% |
| Immigrants | Ghana | 3.7 /100 | #227 | Tragic 63.1% |
| Samoans | 3.3 /100 | #228 | Tragic 63.0% |
| Liberians | 3.2 /100 | #229 | Tragic 63.0% |
| Immigrants | Nonimmigrants | 3.0 /100 | #230 | Tragic 62.9% |
| Immigrants | Western Africa | 2.4 /100 | #231 | Tragic 62.8% |