Senegalese vs Immigrants from Austria Associate's Degree
COMPARE
Senegalese
Immigrants from Austria
Associate's Degree
Associate's Degree Comparison
Senegalese
Immigrants from Austria
45.2%
ASSOCIATE'S DEGREE
21.1/ 100
METRIC RATING
200th/ 347
METRIC RANK
52.1%
ASSOCIATE'S DEGREE
99.9/ 100
METRIC RATING
49th/ 347
METRIC RANK
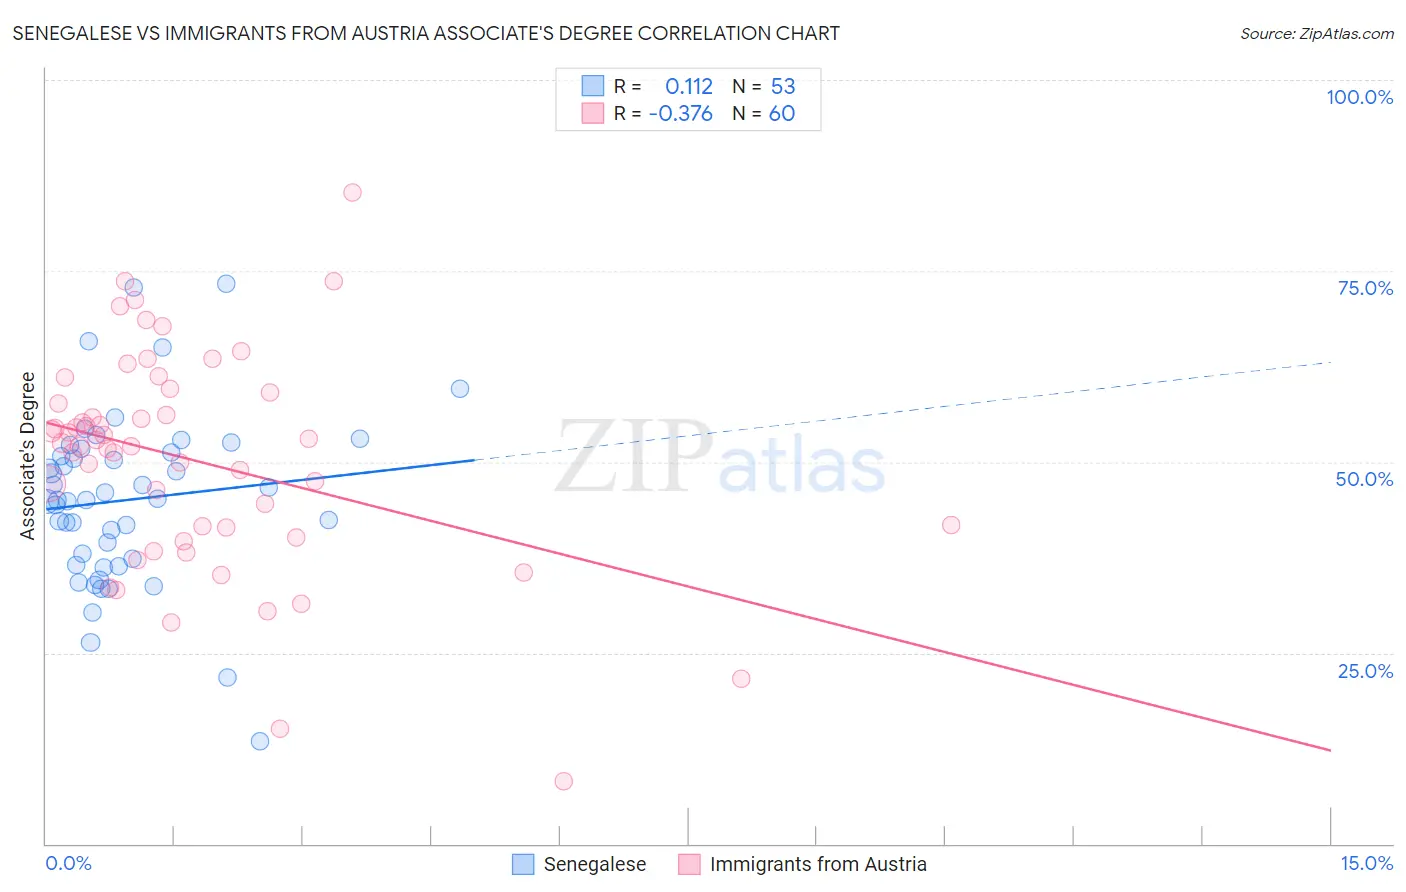
Senegalese vs Immigrants from Austria Associate's Degree Correlation Chart
The statistical analysis conducted on geographies consisting of 78,136,633 people shows a poor positive correlation between the proportion of Senegalese and percentage of population with at least associate's degree education in the United States with a correlation coefficient (R) of 0.112 and weighted average of 45.2%. Similarly, the statistical analysis conducted on geographies consisting of 167,971,732 people shows a mild negative correlation between the proportion of Immigrants from Austria and percentage of population with at least associate's degree education in the United States with a correlation coefficient (R) of -0.376 and weighted average of 52.1%, a difference of 15.3%.
Associate's Degree Correlation Summary
| Measurement | Senegalese | Immigrants from Austria |
| Minimum | 13.4% | 8.2% |
| Maximum | 73.4% | 85.3% |
| Range | 60.0% | 77.1% |
| Mean | 45.0% | 50.1% |
| Median | 44.9% | 52.3% |
| Interquartile 25% (IQ1) | 36.9% | 40.8% |
| Interquartile 75% (IQ3) | 51.4% | 58.4% |
| Interquartile Range (IQR) | 14.5% | 17.6% |
| Standard Deviation (Sample) | 11.3% | 14.4% |
| Standard Deviation (Population) | 11.2% | 14.3% |
Similar Demographics by Associate's Degree
Demographics Similar to Senegalese by Associate's Degree
In terms of associate's degree, the demographic groups most similar to Senegalese are Immigrants from Senegal (45.2%, a difference of 0.010%), Immigrants from Bangladesh (45.2%, a difference of 0.030%), Immigrants from Vietnam (45.2%, a difference of 0.030%), Spaniard (45.2%, a difference of 0.080%), and Immigrants from South Eastern Asia (45.2%, a difference of 0.10%).
| Demographics | Rating | Rank | Associate's Degree |
| Immigrants | Cameroon | 31.0 /100 | #193 | Fair 45.7% |
| Immigrants | Peru | 27.6 /100 | #194 | Fair 45.5% |
| Germans | 26.5 /100 | #195 | Fair 45.5% |
| French | 25.6 /100 | #196 | Fair 45.4% |
| Scotch-Irish | 22.3 /100 | #197 | Fair 45.3% |
| Immigrants | Bangladesh | 21.3 /100 | #198 | Fair 45.2% |
| Immigrants | Senegal | 21.2 /100 | #199 | Fair 45.2% |
| Senegalese | 21.1 /100 | #200 | Fair 45.2% |
| Immigrants | Vietnam | 20.8 /100 | #201 | Fair 45.2% |
| Spaniards | 20.4 /100 | #202 | Fair 45.2% |
| Immigrants | South Eastern Asia | 20.2 /100 | #203 | Fair 45.2% |
| Nigerians | 19.1 /100 | #204 | Poor 45.1% |
| Immigrants | Thailand | 18.9 /100 | #205 | Poor 45.1% |
| German Russians | 18.9 /100 | #206 | Poor 45.1% |
| Panamanians | 18.4 /100 | #207 | Poor 45.1% |
Demographics Similar to Immigrants from Austria by Associate's Degree
In terms of associate's degree, the demographic groups most similar to Immigrants from Austria are Asian (52.1%, a difference of 0.010%), Immigrants from Greece (52.1%, a difference of 0.10%), Immigrants from Norway (52.2%, a difference of 0.20%), Bolivian (52.0%, a difference of 0.30%), and Immigrants from Asia (52.0%, a difference of 0.33%).
| Demographics | Rating | Rank | Associate's Degree |
| Immigrants | Malaysia | 99.9 /100 | #42 | Exceptional 52.5% |
| Immigrants | South Africa | 99.9 /100 | #43 | Exceptional 52.5% |
| Estonians | 99.9 /100 | #44 | Exceptional 52.5% |
| Immigrants | Lithuania | 99.9 /100 | #45 | Exceptional 52.4% |
| Immigrants | Bulgaria | 99.9 /100 | #46 | Exceptional 52.4% |
| Immigrants | Kuwait | 99.9 /100 | #47 | Exceptional 52.4% |
| Immigrants | Norway | 99.9 /100 | #48 | Exceptional 52.2% |
| Immigrants | Austria | 99.9 /100 | #49 | Exceptional 52.1% |
| Asians | 99.9 /100 | #50 | Exceptional 52.1% |
| Immigrants | Greece | 99.9 /100 | #51 | Exceptional 52.1% |
| Bolivians | 99.8 /100 | #52 | Exceptional 52.0% |
| Immigrants | Asia | 99.8 /100 | #53 | Exceptional 52.0% |
| Immigrants | Spain | 99.8 /100 | #54 | Exceptional 51.9% |
| Australians | 99.8 /100 | #55 | Exceptional 51.9% |
| Immigrants | Czechoslovakia | 99.8 /100 | #56 | Exceptional 51.9% |