Senegalese vs Immigrants from Europe Associate's Degree
COMPARE
Senegalese
Immigrants from Europe
Associate's Degree
Associate's Degree Comparison
Senegalese
Immigrants from Europe
45.2%
ASSOCIATE'S DEGREE
21.1/ 100
METRIC RATING
200th/ 347
METRIC RANK
51.3%
ASSOCIATE'S DEGREE
99.7/ 100
METRIC RATING
66th/ 347
METRIC RANK
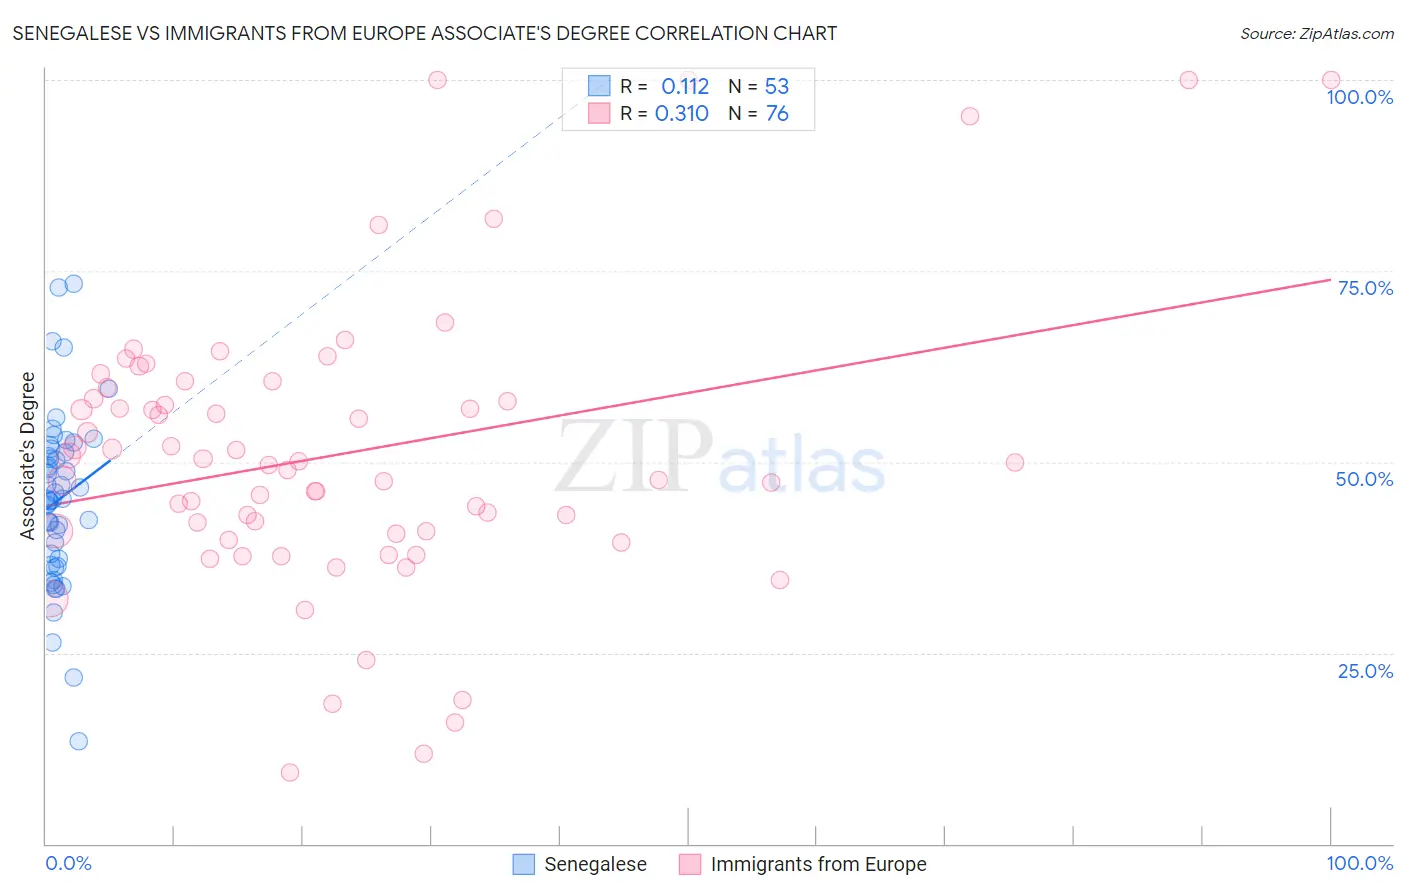
Senegalese vs Immigrants from Europe Associate's Degree Correlation Chart
The statistical analysis conducted on geographies consisting of 78,136,633 people shows a poor positive correlation between the proportion of Senegalese and percentage of population with at least associate's degree education in the United States with a correlation coefficient (R) of 0.112 and weighted average of 45.2%. Similarly, the statistical analysis conducted on geographies consisting of 547,360,790 people shows a mild positive correlation between the proportion of Immigrants from Europe and percentage of population with at least associate's degree education in the United States with a correlation coefficient (R) of 0.310 and weighted average of 51.3%, a difference of 13.5%.
Associate's Degree Correlation Summary
| Measurement | Senegalese | Immigrants from Europe |
| Minimum | 13.4% | 9.3% |
| Maximum | 73.4% | 100.0% |
| Range | 60.0% | 90.7% |
| Mean | 45.0% | 51.1% |
| Median | 44.9% | 49.8% |
| Interquartile 25% (IQ1) | 36.9% | 40.8% |
| Interquartile 75% (IQ3) | 51.4% | 59.0% |
| Interquartile Range (IQR) | 14.5% | 18.2% |
| Standard Deviation (Sample) | 11.3% | 18.8% |
| Standard Deviation (Population) | 11.2% | 18.7% |
Similar Demographics by Associate's Degree
Demographics Similar to Senegalese by Associate's Degree
In terms of associate's degree, the demographic groups most similar to Senegalese are Immigrants from Senegal (45.2%, a difference of 0.010%), Immigrants from Bangladesh (45.2%, a difference of 0.030%), Immigrants from Vietnam (45.2%, a difference of 0.030%), Spaniard (45.2%, a difference of 0.080%), and Immigrants from South Eastern Asia (45.2%, a difference of 0.10%).
| Demographics | Rating | Rank | Associate's Degree |
| Immigrants | Cameroon | 31.0 /100 | #193 | Fair 45.7% |
| Immigrants | Peru | 27.6 /100 | #194 | Fair 45.5% |
| Germans | 26.5 /100 | #195 | Fair 45.5% |
| French | 25.6 /100 | #196 | Fair 45.4% |
| Scotch-Irish | 22.3 /100 | #197 | Fair 45.3% |
| Immigrants | Bangladesh | 21.3 /100 | #198 | Fair 45.2% |
| Immigrants | Senegal | 21.2 /100 | #199 | Fair 45.2% |
| Senegalese | 21.1 /100 | #200 | Fair 45.2% |
| Immigrants | Vietnam | 20.8 /100 | #201 | Fair 45.2% |
| Spaniards | 20.4 /100 | #202 | Fair 45.2% |
| Immigrants | South Eastern Asia | 20.2 /100 | #203 | Fair 45.2% |
| Nigerians | 19.1 /100 | #204 | Poor 45.1% |
| Immigrants | Thailand | 18.9 /100 | #205 | Poor 45.1% |
| German Russians | 18.9 /100 | #206 | Poor 45.1% |
| Panamanians | 18.4 /100 | #207 | Poor 45.1% |
Demographics Similar to Immigrants from Europe by Associate's Degree
In terms of associate's degree, the demographic groups most similar to Immigrants from Europe are Zimbabwean (51.3%, a difference of 0.050%), Immigrants from Netherlands (51.4%, a difference of 0.080%), Argentinean (51.2%, a difference of 0.13%), South African (51.4%, a difference of 0.16%), and Immigrants from Kazakhstan (51.4%, a difference of 0.21%).
| Demographics | Rating | Rank | Associate's Degree |
| Immigrants | Serbia | 99.8 /100 | #59 | Exceptional 51.7% |
| Immigrants | Bolivia | 99.7 /100 | #60 | Exceptional 51.5% |
| Immigrants | Kazakhstan | 99.7 /100 | #61 | Exceptional 51.4% |
| Bhutanese | 99.7 /100 | #62 | Exceptional 51.4% |
| South Africans | 99.7 /100 | #63 | Exceptional 51.4% |
| Immigrants | Netherlands | 99.7 /100 | #64 | Exceptional 51.4% |
| Zimbabweans | 99.7 /100 | #65 | Exceptional 51.3% |
| Immigrants | Europe | 99.7 /100 | #66 | Exceptional 51.3% |
| Argentineans | 99.6 /100 | #67 | Exceptional 51.2% |
| Immigrants | Indonesia | 99.5 /100 | #68 | Exceptional 51.0% |
| Egyptians | 99.5 /100 | #69 | Exceptional 50.9% |
| Immigrants | Argentina | 99.5 /100 | #70 | Exceptional 50.9% |
| Immigrants | Romania | 99.5 /100 | #71 | Exceptional 50.9% |
| Immigrants | Pakistan | 99.5 /100 | #72 | Exceptional 50.9% |
| Carpatho Rusyns | 99.3 /100 | #73 | Exceptional 50.6% |