Senegalese vs Immigrants from North Macedonia College, Under 1 year
COMPARE
Senegalese
Immigrants from North Macedonia
College, Under 1 year
College, Under 1 year Comparison
Senegalese
Immigrants from North Macedonia
63.6%
COLLEGE, UNDER 1 YEAR
7.7/ 100
METRIC RATING
215th/ 347
METRIC RANK
65.4%
COLLEGE, UNDER 1 YEAR
48.6/ 100
METRIC RATING
177th/ 347
METRIC RANK
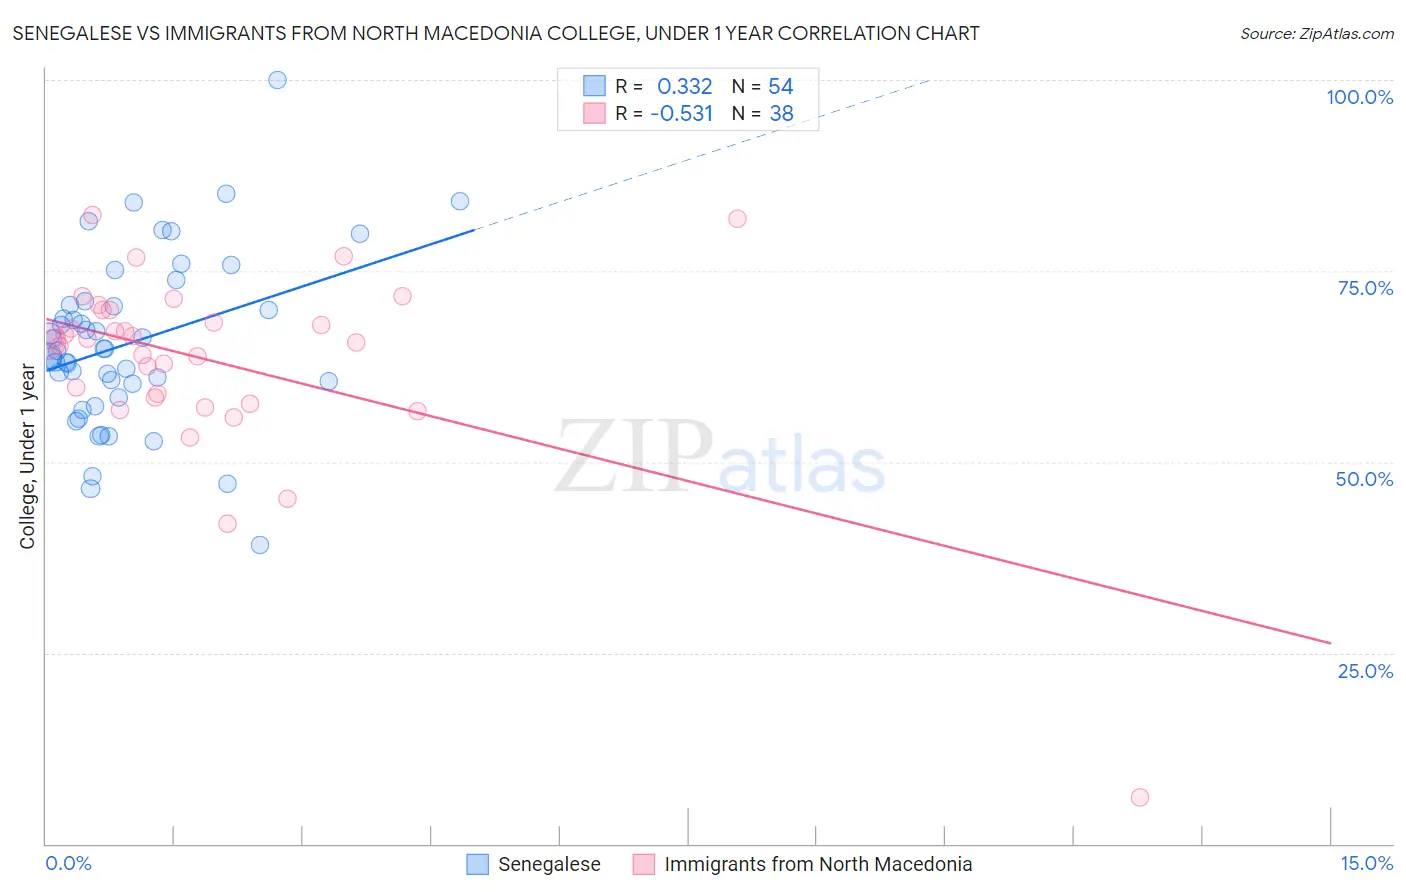
Senegalese vs Immigrants from North Macedonia College, Under 1 year Correlation Chart
The statistical analysis conducted on geographies consisting of 78,142,569 people shows a mild positive correlation between the proportion of Senegalese and percentage of population with at least college, under 1 year education in the United States with a correlation coefficient (R) of 0.332 and weighted average of 63.6%. Similarly, the statistical analysis conducted on geographies consisting of 74,317,186 people shows a substantial negative correlation between the proportion of Immigrants from North Macedonia and percentage of population with at least college, under 1 year education in the United States with a correlation coefficient (R) of -0.531 and weighted average of 65.4%, a difference of 2.8%.
College, Under 1 year Correlation Summary
| Measurement | Senegalese | Immigrants from North Macedonia |
| Minimum | 39.1% | 6.0% |
| Maximum | 100.0% | 82.4% |
| Range | 60.9% | 76.3% |
| Mean | 65.6% | 63.2% |
| Median | 64.7% | 65.9% |
| Interquartile 25% (IQ1) | 60.2% | 58.4% |
| Interquartile 75% (IQ3) | 70.5% | 69.8% |
| Interquartile Range (IQR) | 10.4% | 11.5% |
| Standard Deviation (Sample) | 11.1% | 12.7% |
| Standard Deviation (Population) | 11.0% | 12.6% |
Similar Demographics by College, Under 1 year
Demographics Similar to Senegalese by College, Under 1 year
In terms of college, under 1 year, the demographic groups most similar to Senegalese are Hmong (63.5%, a difference of 0.15%), Immigrants from Nigeria (63.7%, a difference of 0.17%), Immigrants from South America (63.8%, a difference of 0.21%), Immigrants from Uruguay (63.4%, a difference of 0.34%), and Immigrants from Panama (63.4%, a difference of 0.36%).
| Demographics | Rating | Rank | College, Under 1 year |
| Immigrants | Vietnam | 12.1 /100 | #208 | Poor 64.0% |
| Puget Sound Salish | 11.3 /100 | #209 | Poor 63.9% |
| Ghanaians | 11.2 /100 | #210 | Poor 63.9% |
| Native Hawaiians | 10.6 /100 | #211 | Poor 63.9% |
| Immigrants | Middle Africa | 10.5 /100 | #212 | Poor 63.9% |
| Immigrants | South America | 9.1 /100 | #213 | Tragic 63.8% |
| Immigrants | Nigeria | 8.8 /100 | #214 | Tragic 63.7% |
| Senegalese | 7.7 /100 | #215 | Tragic 63.6% |
| Hmong | 6.8 /100 | #216 | Tragic 63.5% |
| Immigrants | Uruguay | 5.8 /100 | #217 | Tragic 63.4% |
| Immigrants | Panama | 5.7 /100 | #218 | Tragic 63.4% |
| Immigrants | Fiji | 5.7 /100 | #219 | Tragic 63.4% |
| Portuguese | 5.6 /100 | #220 | Tragic 63.4% |
| Cree | 5.2 /100 | #221 | Tragic 63.3% |
| Immigrants | Senegal | 5.0 /100 | #222 | Tragic 63.3% |
Demographics Similar to Immigrants from North Macedonia by College, Under 1 year
In terms of college, under 1 year, the demographic groups most similar to Immigrants from North Macedonia are French (65.4%, a difference of 0.010%), German Russian (65.4%, a difference of 0.010%), Guamanian/Chamorro (65.4%, a difference of 0.020%), Scotch-Irish (65.4%, a difference of 0.040%), and Immigrants from Bosnia and Herzegovina (65.4%, a difference of 0.060%).
| Demographics | Rating | Rank | College, Under 1 year |
| Germans | 55.7 /100 | #170 | Average 65.6% |
| Immigrants | Oceania | 55.0 /100 | #171 | Average 65.6% |
| South American Indians | 54.4 /100 | #172 | Average 65.5% |
| Swiss | 53.9 /100 | #173 | Average 65.5% |
| Immigrants | Bosnia and Herzegovina | 50.0 /100 | #174 | Average 65.4% |
| Scotch-Irish | 49.5 /100 | #175 | Average 65.4% |
| French | 48.9 /100 | #176 | Average 65.4% |
| Immigrants | North Macedonia | 48.6 /100 | #177 | Average 65.4% |
| German Russians | 48.3 /100 | #178 | Average 65.4% |
| Guamanians/Chamorros | 48.2 /100 | #179 | Average 65.4% |
| Dutch | 46.1 /100 | #180 | Average 65.3% |
| Spaniards | 45.5 /100 | #181 | Average 65.3% |
| Immigrants | Africa | 44.7 /100 | #182 | Average 65.3% |
| Immigrants | Poland | 42.6 /100 | #183 | Average 65.2% |
| Bermudans | 42.0 /100 | #184 | Average 65.2% |