Senegalese vs Hmong College, Under 1 year
COMPARE
Senegalese
Hmong
College, Under 1 year
College, Under 1 year Comparison
Senegalese
Hmong
63.6%
COLLEGE, UNDER 1 YEAR
7.7/ 100
METRIC RATING
215th/ 347
METRIC RANK
63.5%
COLLEGE, UNDER 1 YEAR
6.8/ 100
METRIC RATING
216th/ 347
METRIC RANK
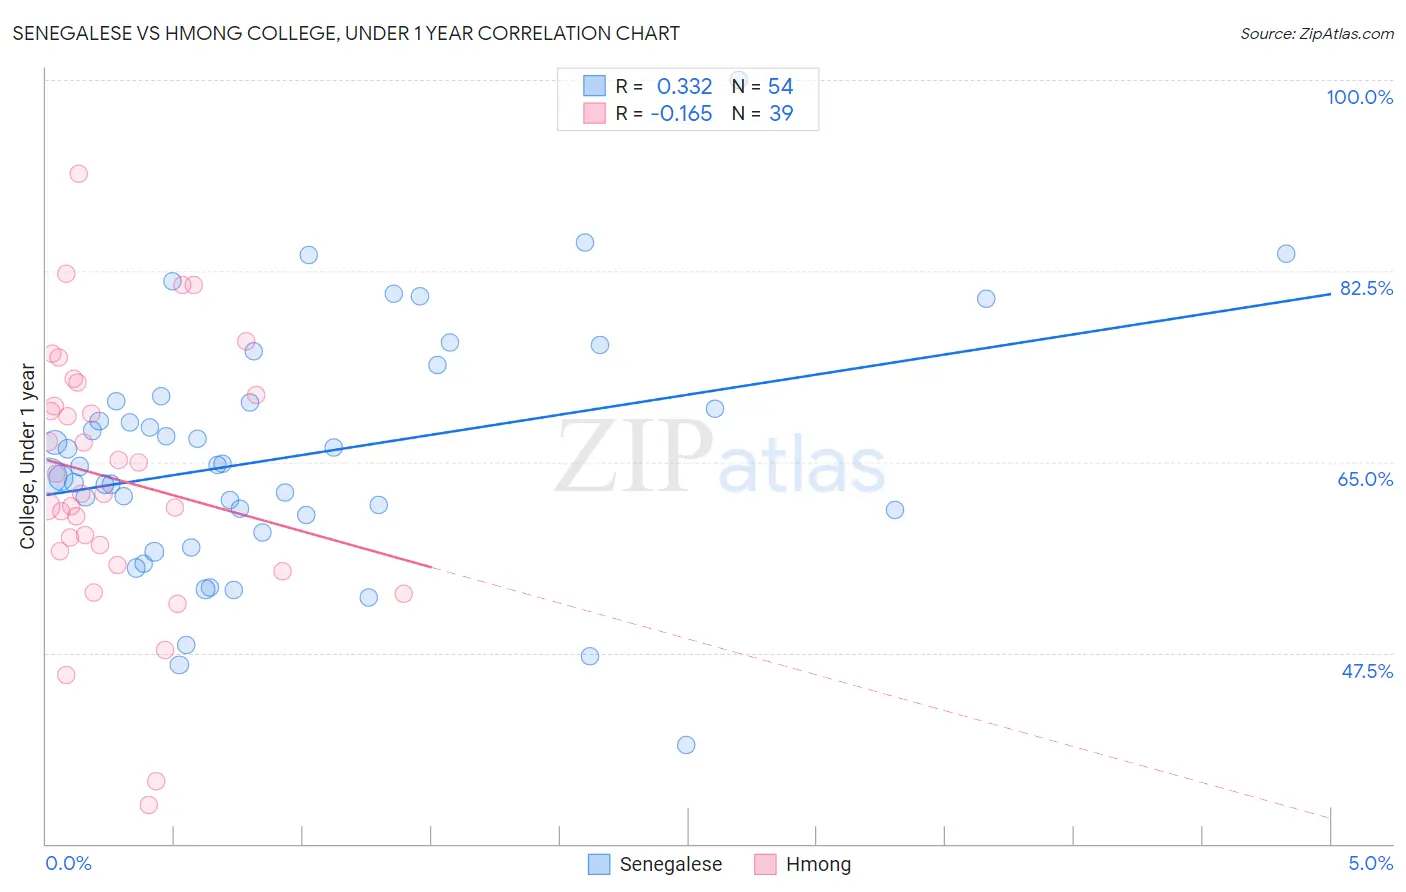
Senegalese vs Hmong College, Under 1 year Correlation Chart
The statistical analysis conducted on geographies consisting of 78,142,569 people shows a mild positive correlation between the proportion of Senegalese and percentage of population with at least college, under 1 year education in the United States with a correlation coefficient (R) of 0.332 and weighted average of 63.6%. Similarly, the statistical analysis conducted on geographies consisting of 24,680,511 people shows a poor negative correlation between the proportion of Hmong and percentage of population with at least college, under 1 year education in the United States with a correlation coefficient (R) of -0.165 and weighted average of 63.5%, a difference of 0.15%.
College, Under 1 year Correlation Summary
| Measurement | Senegalese | Hmong |
| Minimum | 39.1% | 33.5% |
| Maximum | 100.0% | 91.4% |
| Range | 60.9% | 57.8% |
| Mean | 65.6% | 63.4% |
| Median | 64.7% | 62.1% |
| Interquartile 25% (IQ1) | 60.2% | 56.8% |
| Interquartile 75% (IQ3) | 70.5% | 71.1% |
| Interquartile Range (IQR) | 10.4% | 14.3% |
| Standard Deviation (Sample) | 11.1% | 12.0% |
| Standard Deviation (Population) | 11.0% | 11.8% |
Demographics Similar to Senegalese and Hmong by College, Under 1 year
In terms of college, under 1 year, the demographic groups most similar to Senegalese are Immigrants from Nigeria (63.7%, a difference of 0.17%), Immigrants from South America (63.8%, a difference of 0.21%), Immigrants from Uruguay (63.4%, a difference of 0.34%), Immigrants from Panama (63.4%, a difference of 0.36%), and Immigrants from Fiji (63.4%, a difference of 0.37%). Similarly, the demographic groups most similar to Hmong are Immigrants from Uruguay (63.4%, a difference of 0.19%), Immigrants from Panama (63.4%, a difference of 0.21%), Immigrants from Fiji (63.4%, a difference of 0.22%), Portuguese (63.4%, a difference of 0.24%), and Cree (63.3%, a difference of 0.32%).
| Demographics | Rating | Rank | College, Under 1 year |
| Peruvians | 13.7 /100 | #205 | Poor 64.1% |
| Whites/Caucasians | 12.8 /100 | #206 | Poor 64.0% |
| Colombians | 12.4 /100 | #207 | Poor 64.0% |
| Immigrants | Vietnam | 12.1 /100 | #208 | Poor 64.0% |
| Puget Sound Salish | 11.3 /100 | #209 | Poor 63.9% |
| Ghanaians | 11.2 /100 | #210 | Poor 63.9% |
| Native Hawaiians | 10.6 /100 | #211 | Poor 63.9% |
| Immigrants | Middle Africa | 10.5 /100 | #212 | Poor 63.9% |
| Immigrants | South America | 9.1 /100 | #213 | Tragic 63.8% |
| Immigrants | Nigeria | 8.8 /100 | #214 | Tragic 63.7% |
| Senegalese | 7.7 /100 | #215 | Tragic 63.6% |
| Hmong | 6.8 /100 | #216 | Tragic 63.5% |
| Immigrants | Uruguay | 5.8 /100 | #217 | Tragic 63.4% |
| Immigrants | Panama | 5.7 /100 | #218 | Tragic 63.4% |
| Immigrants | Fiji | 5.7 /100 | #219 | Tragic 63.4% |
| Portuguese | 5.6 /100 | #220 | Tragic 63.4% |
| Cree | 5.2 /100 | #221 | Tragic 63.3% |
| Immigrants | Senegal | 5.0 /100 | #222 | Tragic 63.3% |
| Immigrants | Costa Rica | 4.5 /100 | #223 | Tragic 63.2% |
| Sub-Saharan Africans | 4.4 /100 | #224 | Tragic 63.2% |
| Immigrants | Peru | 4.0 /100 | #225 | Tragic 63.1% |