Egyptian vs Immigrants from Portugal Master's Degree
COMPARE
Egyptian
Immigrants from Portugal
Master's Degree
Master's Degree Comparison
Egyptians
Immigrants from Portugal
17.6%
MASTER'S DEGREE
99.6/ 100
METRIC RATING
75th/ 347
METRIC RANK
12.6%
MASTER'S DEGREE
0.8/ 100
METRIC RATING
256th/ 347
METRIC RANK
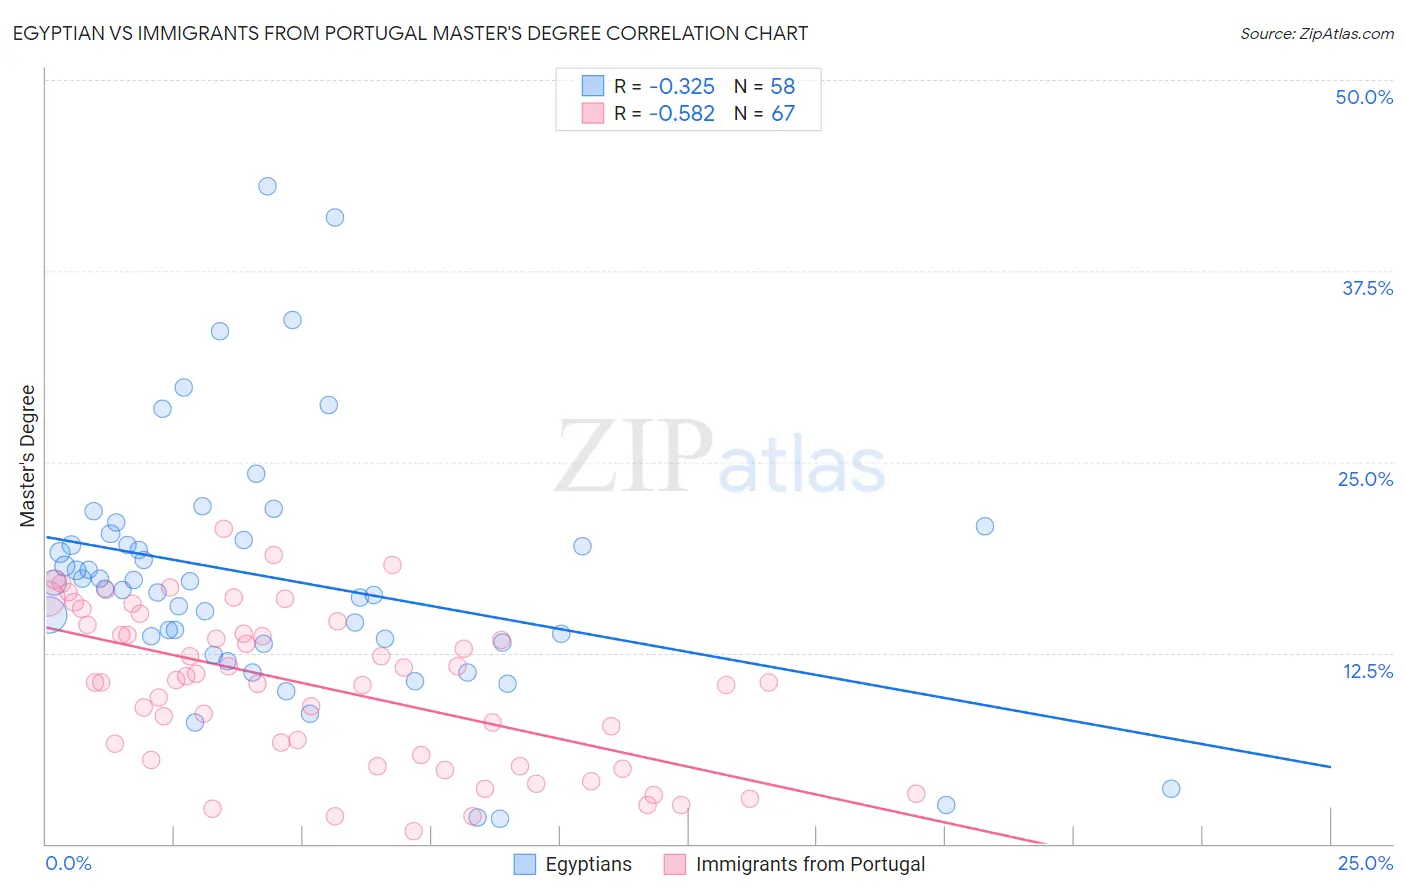
Egyptian vs Immigrants from Portugal Master's Degree Correlation Chart
The statistical analysis conducted on geographies consisting of 276,863,578 people shows a mild negative correlation between the proportion of Egyptians and percentage of population with at least master's degree education in the United States with a correlation coefficient (R) of -0.325 and weighted average of 17.6%. Similarly, the statistical analysis conducted on geographies consisting of 174,778,978 people shows a substantial negative correlation between the proportion of Immigrants from Portugal and percentage of population with at least master's degree education in the United States with a correlation coefficient (R) of -0.582 and weighted average of 12.6%, a difference of 39.4%.
Master's Degree Correlation Summary
| Measurement | Egyptian | Immigrants from Portugal |
| Minimum | 1.6% | 0.81% |
| Maximum | 43.1% | 20.6% |
| Range | 41.4% | 19.8% |
| Mean | 17.4% | 10.3% |
| Median | 16.9% | 10.6% |
| Interquartile 25% (IQ1) | 13.2% | 5.5% |
| Interquartile 75% (IQ3) | 19.9% | 14.3% |
| Interquartile Range (IQR) | 6.7% | 8.8% |
| Standard Deviation (Sample) | 8.2% | 5.1% |
| Standard Deviation (Population) | 8.1% | 5.1% |
Similar Demographics by Master's Degree
Demographics Similar to Egyptians by Master's Degree
In terms of master's degree, the demographic groups most similar to Egyptians are Immigrants from Indonesia (17.6%, a difference of 0.030%), Immigrants from Eastern Europe (17.6%, a difference of 0.14%), Immigrants from Hungary (17.5%, a difference of 0.34%), Immigrants from Romania (17.7%, a difference of 0.38%), and Immigrants from Lebanon (17.5%, a difference of 0.47%).
| Demographics | Rating | Rank | Master's Degree |
| Immigrants | Ethiopia | 99.8 /100 | #68 | Exceptional 17.9% |
| Immigrants | Uzbekistan | 99.8 /100 | #69 | Exceptional 17.9% |
| Immigrants | Western Europe | 99.8 /100 | #70 | Exceptional 17.8% |
| Immigrants | Pakistan | 99.7 /100 | #71 | Exceptional 17.8% |
| Lithuanians | 99.7 /100 | #72 | Exceptional 17.7% |
| Zimbabweans | 99.7 /100 | #73 | Exceptional 17.7% |
| Immigrants | Romania | 99.7 /100 | #74 | Exceptional 17.7% |
| Egyptians | 99.6 /100 | #75 | Exceptional 17.6% |
| Immigrants | Indonesia | 99.6 /100 | #76 | Exceptional 17.6% |
| Immigrants | Eastern Europe | 99.6 /100 | #77 | Exceptional 17.6% |
| Immigrants | Hungary | 99.6 /100 | #78 | Exceptional 17.5% |
| Immigrants | Lebanon | 99.6 /100 | #79 | Exceptional 17.5% |
| Carpatho Rusyns | 99.6 /100 | #80 | Exceptional 17.5% |
| Immigrants | Western Asia | 99.5 /100 | #81 | Exceptional 17.5% |
| Greeks | 99.5 /100 | #82 | Exceptional 17.5% |
Demographics Similar to Immigrants from Portugal by Master's Degree
In terms of master's degree, the demographic groups most similar to Immigrants from Portugal are Immigrants from Congo (12.6%, a difference of 0.080%), Indonesian (12.6%, a difference of 0.10%), Immigrants from Dominica (12.6%, a difference of 0.14%), Osage (12.6%, a difference of 0.48%), and French American Indian (12.7%, a difference of 0.69%).
| Demographics | Rating | Rank | Master's Degree |
| Cree | 1.3 /100 | #249 | Tragic 12.8% |
| Liberians | 1.3 /100 | #250 | Tragic 12.8% |
| Tlingit-Haida | 1.3 /100 | #251 | Tragic 12.8% |
| French American Indians | 1.0 /100 | #252 | Tragic 12.7% |
| Immigrants | Dominica | 0.8 /100 | #253 | Tragic 12.6% |
| Indonesians | 0.8 /100 | #254 | Tragic 12.6% |
| Immigrants | Congo | 0.8 /100 | #255 | Tragic 12.6% |
| Immigrants | Portugal | 0.8 /100 | #256 | Tragic 12.6% |
| Osage | 0.7 /100 | #257 | Tragic 12.6% |
| Immigrants | Liberia | 0.6 /100 | #258 | Tragic 12.5% |
| Japanese | 0.6 /100 | #259 | Tragic 12.5% |
| Dominicans | 0.6 /100 | #260 | Tragic 12.5% |
| Tongans | 0.6 /100 | #261 | Tragic 12.5% |
| Nicaraguans | 0.6 /100 | #262 | Tragic 12.5% |
| Central American Indians | 0.5 /100 | #263 | Tragic 12.4% |