Senegalese vs Immigrants from Japan Doctorate Degree
COMPARE
Senegalese
Immigrants from Japan
Doctorate Degree
Doctorate Degree Comparison
Senegalese
Immigrants from Japan
2.0%
DOCTORATE DEGREE
86.7/ 100
METRIC RATING
141st/ 347
METRIC RANK
2.8%
DOCTORATE DEGREE
100.0/ 100
METRIC RATING
19th/ 347
METRIC RANK
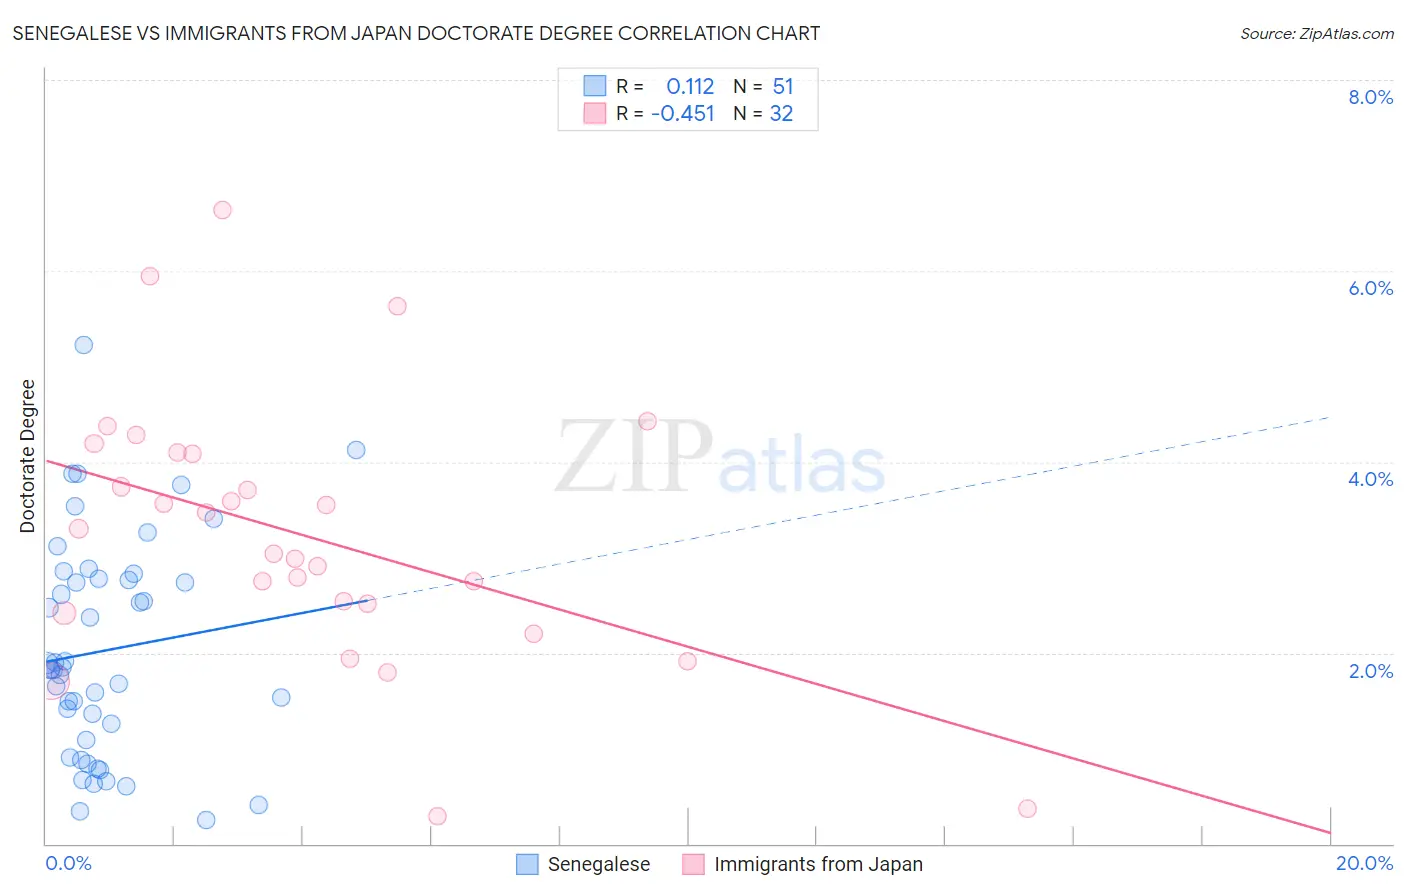
Senegalese vs Immigrants from Japan Doctorate Degree Correlation Chart
The statistical analysis conducted on geographies consisting of 78,037,705 people shows a poor positive correlation between the proportion of Senegalese and percentage of population with at least doctorate degree education in the United States with a correlation coefficient (R) of 0.112 and weighted average of 2.0%. Similarly, the statistical analysis conducted on geographies consisting of 338,241,347 people shows a moderate negative correlation between the proportion of Immigrants from Japan and percentage of population with at least doctorate degree education in the United States with a correlation coefficient (R) of -0.451 and weighted average of 2.8%, a difference of 41.7%.
Doctorate Degree Correlation Summary
| Measurement | Senegalese | Immigrants from Japan |
| Minimum | 0.24% | 0.28% |
| Maximum | 5.2% | 6.6% |
| Range | 5.0% | 6.4% |
| Mean | 2.0% | 3.2% |
| Median | 1.8% | 3.2% |
| Interquartile 25% (IQ1) | 1.1% | 2.5% |
| Interquartile 75% (IQ3) | 2.8% | 4.1% |
| Interquartile Range (IQR) | 1.7% | 1.6% |
| Standard Deviation (Sample) | 1.1% | 1.4% |
| Standard Deviation (Population) | 1.1% | 1.4% |
Similar Demographics by Doctorate Degree
Demographics Similar to Senegalese by Doctorate Degree
In terms of doctorate degree, the demographic groups most similar to Senegalese are Immigrants from Africa (2.0%, a difference of 0.070%), Afghan (2.0%, a difference of 0.16%), Italian (2.0%, a difference of 0.21%), Swiss (2.0%, a difference of 0.38%), and Sierra Leonean (2.0%, a difference of 0.46%).
| Demographics | Rating | Rank | Doctorate Degree |
| Immigrants | Cameroon | 88.9 /100 | #134 | Excellent 2.0% |
| Serbians | 88.7 /100 | #135 | Excellent 2.0% |
| Swedes | 88.3 /100 | #136 | Excellent 2.0% |
| South American Indians | 88.3 /100 | #137 | Excellent 2.0% |
| Swiss | 88.0 /100 | #138 | Excellent 2.0% |
| Afghans | 87.2 /100 | #139 | Excellent 2.0% |
| Immigrants | Africa | 87.0 /100 | #140 | Excellent 2.0% |
| Senegalese | 86.7 /100 | #141 | Excellent 2.0% |
| Italians | 86.0 /100 | #142 | Excellent 2.0% |
| Sierra Leoneans | 85.1 /100 | #143 | Excellent 2.0% |
| Immigrants | Moldova | 84.3 /100 | #144 | Excellent 2.0% |
| Kenyans | 83.6 /100 | #145 | Excellent 1.9% |
| Immigrants | Syria | 83.6 /100 | #146 | Excellent 1.9% |
| Immigrants | Senegal | 82.5 /100 | #147 | Excellent 1.9% |
| Luxembourgers | 81.1 /100 | #148 | Excellent 1.9% |
Demographics Similar to Immigrants from Japan by Doctorate Degree
In terms of doctorate degree, the demographic groups most similar to Immigrants from Japan are Immigrants from Hong Kong (2.8%, a difference of 0.35%), Immigrants from Sri Lanka (2.8%, a difference of 0.37%), Immigrants from Australia (2.8%, a difference of 0.62%), Thai (2.8%, a difference of 0.70%), and Mongolian (2.8%, a difference of 0.91%).
| Demographics | Rating | Rank | Doctorate Degree |
| Immigrants | Belgium | 100.0 /100 | #12 | Exceptional 2.9% |
| Immigrants | Sweden | 100.0 /100 | #13 | Exceptional 2.9% |
| Immigrants | France | 100.0 /100 | #14 | Exceptional 2.9% |
| Immigrants | India | 100.0 /100 | #15 | Exceptional 2.8% |
| Eastern Europeans | 100.0 /100 | #16 | Exceptional 2.8% |
| Immigrants | Australia | 100.0 /100 | #17 | Exceptional 2.8% |
| Immigrants | Sri Lanka | 100.0 /100 | #18 | Exceptional 2.8% |
| Immigrants | Japan | 100.0 /100 | #19 | Exceptional 2.8% |
| Immigrants | Hong Kong | 100.0 /100 | #20 | Exceptional 2.8% |
| Thais | 100.0 /100 | #21 | Exceptional 2.8% |
| Mongolians | 100.0 /100 | #22 | Exceptional 2.8% |
| Immigrants | Denmark | 100.0 /100 | #23 | Exceptional 2.8% |
| Israelis | 100.0 /100 | #24 | Exceptional 2.7% |
| Immigrants | Saudi Arabia | 100.0 /100 | #25 | Exceptional 2.7% |
| Turks | 100.0 /100 | #26 | Exceptional 2.7% |