Central American vs Immigrants from Japan Doctorate Degree
COMPARE
Central American
Immigrants from Japan
Doctorate Degree
Doctorate Degree Comparison
Central Americans
Immigrants from Japan
1.5%
DOCTORATE DEGREE
0.3/ 100
METRIC RATING
283rd/ 347
METRIC RANK
2.8%
DOCTORATE DEGREE
100.0/ 100
METRIC RATING
19th/ 347
METRIC RANK
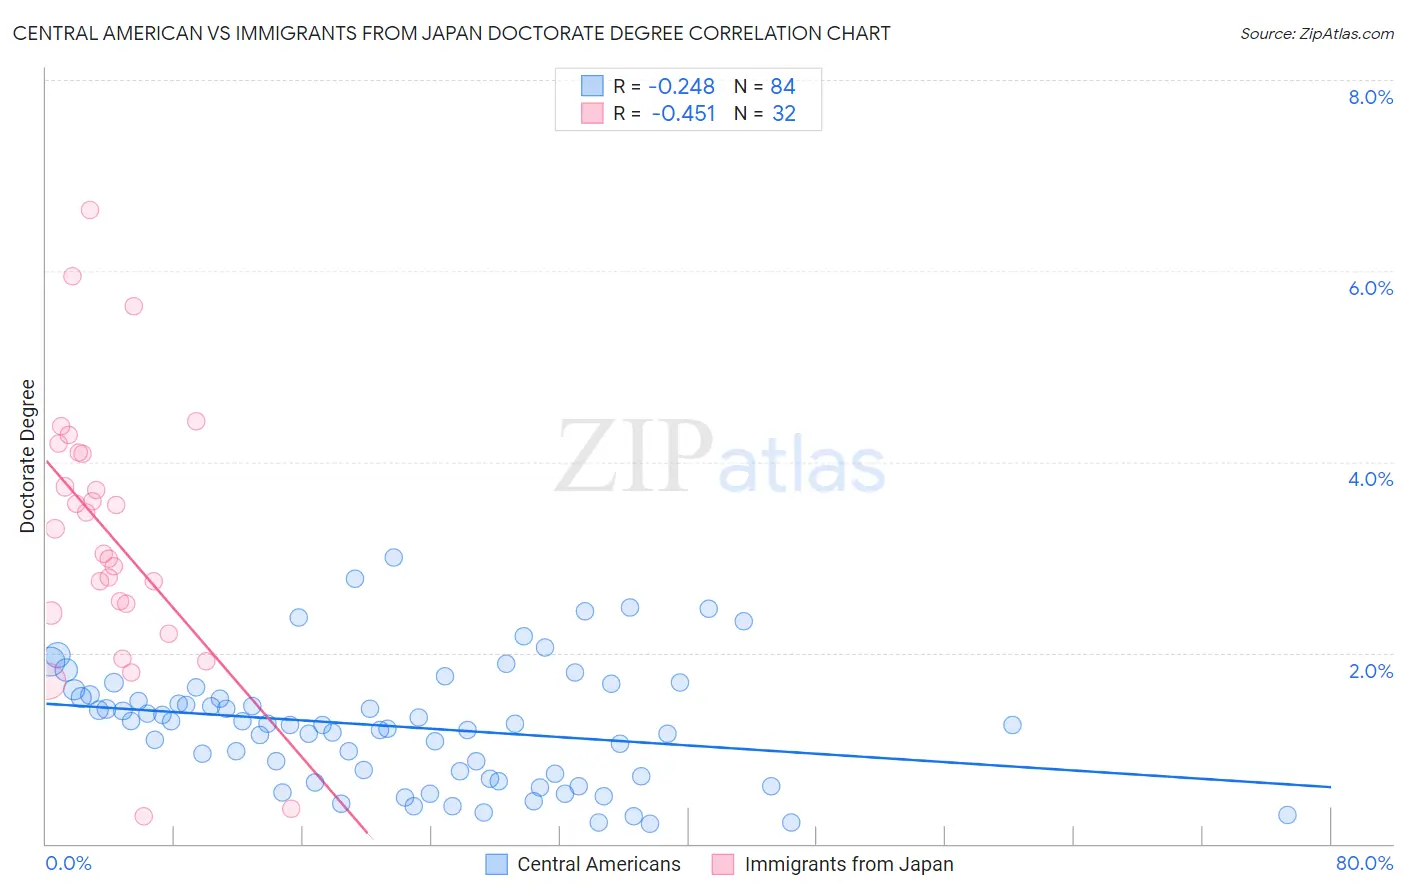
Central American vs Immigrants from Japan Doctorate Degree Correlation Chart
The statistical analysis conducted on geographies consisting of 493,729,899 people shows a weak negative correlation between the proportion of Central Americans and percentage of population with at least doctorate degree education in the United States with a correlation coefficient (R) of -0.248 and weighted average of 1.5%. Similarly, the statistical analysis conducted on geographies consisting of 338,241,347 people shows a moderate negative correlation between the proportion of Immigrants from Japan and percentage of population with at least doctorate degree education in the United States with a correlation coefficient (R) of -0.451 and weighted average of 2.8%, a difference of 91.1%.
Doctorate Degree Correlation Summary
| Measurement | Central American | Immigrants from Japan |
| Minimum | 0.21% | 0.28% |
| Maximum | 3.0% | 6.6% |
| Range | 2.8% | 6.4% |
| Mean | 1.2% | 3.2% |
| Median | 1.2% | 3.2% |
| Interquartile 25% (IQ1) | 0.69% | 2.5% |
| Interquartile 75% (IQ3) | 1.5% | 4.1% |
| Interquartile Range (IQR) | 0.85% | 1.6% |
| Standard Deviation (Sample) | 0.63% | 1.4% |
| Standard Deviation (Population) | 0.63% | 1.4% |
Similar Demographics by Doctorate Degree
Demographics Similar to Central Americans by Doctorate Degree
In terms of doctorate degree, the demographic groups most similar to Central Americans are Jamaican (1.5%, a difference of 0.040%), British West Indian (1.5%, a difference of 0.050%), Malaysian (1.5%, a difference of 0.070%), Tohono O'odham (1.5%, a difference of 0.10%), and Ecuadorian (1.5%, a difference of 0.16%).
| Demographics | Rating | Rank | Doctorate Degree |
| Paiute | 0.4 /100 | #276 | Tragic 1.5% |
| Bahamians | 0.4 /100 | #277 | Tragic 1.5% |
| Hawaiians | 0.4 /100 | #278 | Tragic 1.5% |
| Marshallese | 0.4 /100 | #279 | Tragic 1.5% |
| Ecuadorians | 0.4 /100 | #280 | Tragic 1.5% |
| Tohono O'odham | 0.4 /100 | #281 | Tragic 1.5% |
| British West Indians | 0.3 /100 | #282 | Tragic 1.5% |
| Central Americans | 0.3 /100 | #283 | Tragic 1.5% |
| Jamaicans | 0.3 /100 | #284 | Tragic 1.5% |
| Malaysians | 0.3 /100 | #285 | Tragic 1.5% |
| Cherokee | 0.3 /100 | #286 | Tragic 1.5% |
| Cajuns | 0.3 /100 | #287 | Tragic 1.5% |
| Immigrants | El Salvador | 0.3 /100 | #288 | Tragic 1.4% |
| Cape Verdeans | 0.3 /100 | #289 | Tragic 1.4% |
| Choctaw | 0.3 /100 | #290 | Tragic 1.4% |
Demographics Similar to Immigrants from Japan by Doctorate Degree
In terms of doctorate degree, the demographic groups most similar to Immigrants from Japan are Immigrants from Hong Kong (2.8%, a difference of 0.35%), Immigrants from Sri Lanka (2.8%, a difference of 0.37%), Immigrants from Australia (2.8%, a difference of 0.62%), Thai (2.8%, a difference of 0.70%), and Mongolian (2.8%, a difference of 0.91%).
| Demographics | Rating | Rank | Doctorate Degree |
| Immigrants | Belgium | 100.0 /100 | #12 | Exceptional 2.9% |
| Immigrants | Sweden | 100.0 /100 | #13 | Exceptional 2.9% |
| Immigrants | France | 100.0 /100 | #14 | Exceptional 2.9% |
| Immigrants | India | 100.0 /100 | #15 | Exceptional 2.8% |
| Eastern Europeans | 100.0 /100 | #16 | Exceptional 2.8% |
| Immigrants | Australia | 100.0 /100 | #17 | Exceptional 2.8% |
| Immigrants | Sri Lanka | 100.0 /100 | #18 | Exceptional 2.8% |
| Immigrants | Japan | 100.0 /100 | #19 | Exceptional 2.8% |
| Immigrants | Hong Kong | 100.0 /100 | #20 | Exceptional 2.8% |
| Thais | 100.0 /100 | #21 | Exceptional 2.8% |
| Mongolians | 100.0 /100 | #22 | Exceptional 2.8% |
| Immigrants | Denmark | 100.0 /100 | #23 | Exceptional 2.8% |
| Israelis | 100.0 /100 | #24 | Exceptional 2.7% |
| Immigrants | Saudi Arabia | 100.0 /100 | #25 | Exceptional 2.7% |
| Turks | 100.0 /100 | #26 | Exceptional 2.7% |