Senegalese vs Immigrants from Japan In Labor Force | Age 16-19
COMPARE
Senegalese
Immigrants from Japan
In Labor Force | Age 16-19
In Labor Force | Age 16-19 Comparison
Senegalese
Immigrants from Japan
35.9%
IN LABOR FORCE | AGE 16-19
17.4/ 100
METRIC RATING
202nd/ 347
METRIC RANK
34.7%
IN LABOR FORCE | AGE 16-19
1.5/ 100
METRIC RATING
253rd/ 347
METRIC RANK
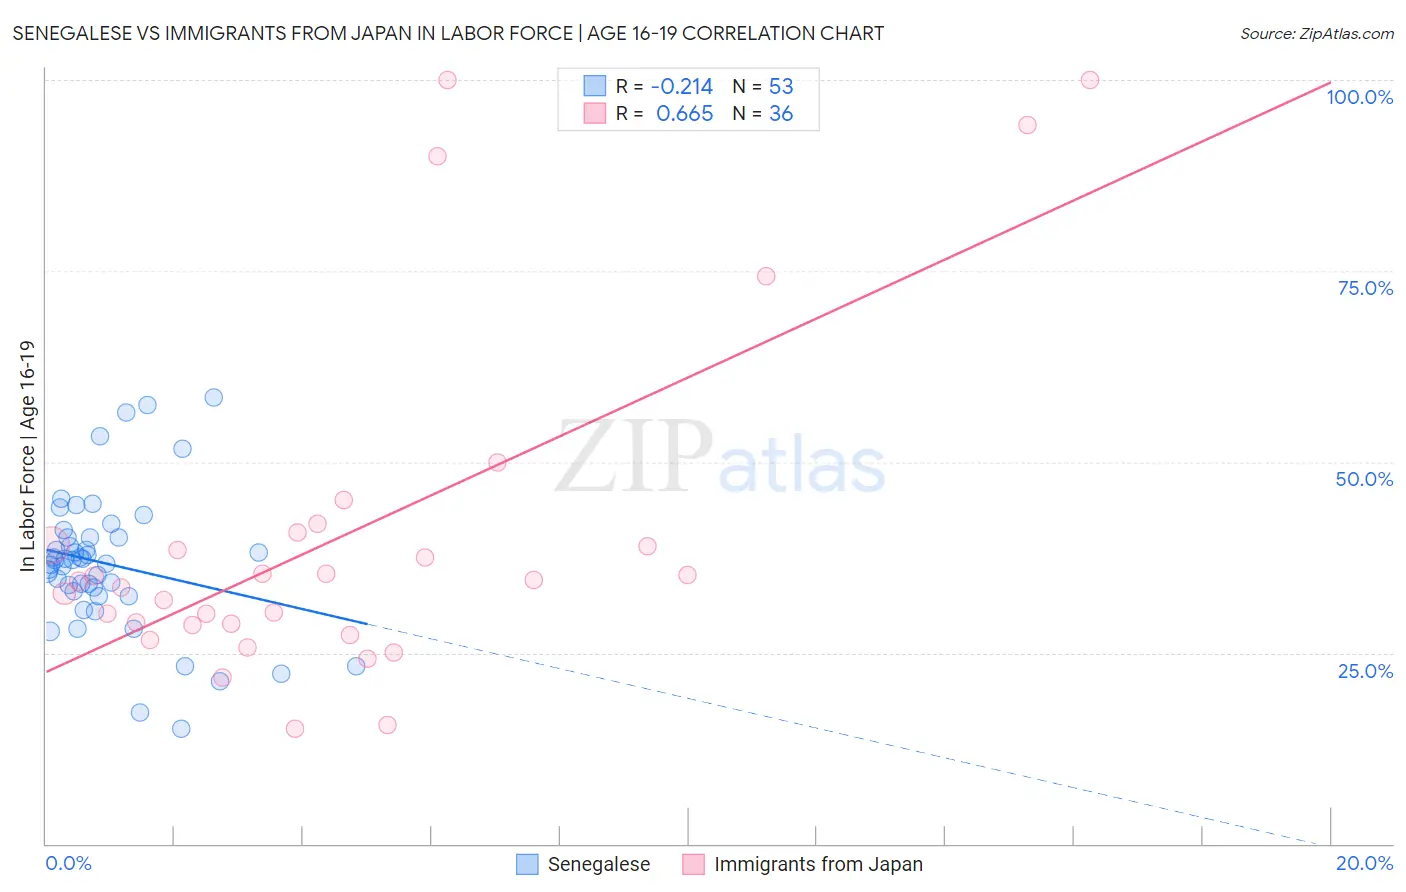
Senegalese vs Immigrants from Japan In Labor Force | Age 16-19 Correlation Chart
The statistical analysis conducted on geographies consisting of 78,118,537 people shows a weak negative correlation between the proportion of Senegalese and labor force participation rate among population between the ages 16 and 19 in the United States with a correlation coefficient (R) of -0.214 and weighted average of 35.9%. Similarly, the statistical analysis conducted on geographies consisting of 339,742,908 people shows a significant positive correlation between the proportion of Immigrants from Japan and labor force participation rate among population between the ages 16 and 19 in the United States with a correlation coefficient (R) of 0.665 and weighted average of 34.7%, a difference of 3.5%.
In Labor Force | Age 16-19 Correlation Summary
| Measurement | Senegalese | Immigrants from Japan |
| Minimum | 15.0% | 15.0% |
| Maximum | 58.4% | 100.0% |
| Range | 43.4% | 85.0% |
| Mean | 36.6% | 40.4% |
| Median | 37.2% | 34.4% |
| Interquartile 25% (IQ1) | 32.7% | 28.7% |
| Interquartile 75% (IQ3) | 40.1% | 39.9% |
| Interquartile Range (IQR) | 7.4% | 11.2% |
| Standard Deviation (Sample) | 9.0% | 22.4% |
| Standard Deviation (Population) | 8.9% | 22.0% |
Similar Demographics by In Labor Force | Age 16-19
Demographics Similar to Senegalese by In Labor Force | Age 16-19
In terms of in labor force | age 16-19, the demographic groups most similar to Senegalese are Alsatian (35.9%, a difference of 0.010%), Immigrants from Nigeria (35.8%, a difference of 0.060%), Immigrants from Sweden (35.9%, a difference of 0.12%), Immigrants from Norway (35.9%, a difference of 0.20%), and Immigrants from Northern Africa (35.9%, a difference of 0.21%).
| Demographics | Rating | Rank | In Labor Force | Age 16-19 |
| Bolivians | 23.3 /100 | #195 | Fair 36.0% |
| Mexican American Indians | 21.1 /100 | #196 | Fair 36.0% |
| Immigrants | Serbia | 21.0 /100 | #197 | Fair 36.0% |
| Immigrants | Northern Africa | 19.9 /100 | #198 | Poor 35.9% |
| Immigrants | Norway | 19.8 /100 | #199 | Poor 35.9% |
| Immigrants | Sweden | 18.8 /100 | #200 | Poor 35.9% |
| Alsatians | 17.5 /100 | #201 | Poor 35.9% |
| Senegalese | 17.4 /100 | #202 | Poor 35.9% |
| Immigrants | Nigeria | 16.8 /100 | #203 | Poor 35.8% |
| Immigrants | Albania | 15.0 /100 | #204 | Poor 35.8% |
| South American Indians | 14.6 /100 | #205 | Poor 35.8% |
| Chileans | 14.6 /100 | #206 | Poor 35.8% |
| Immigrants | Eastern Europe | 14.5 /100 | #207 | Poor 35.8% |
| Koreans | 13.3 /100 | #208 | Poor 35.7% |
| Moroccans | 12.7 /100 | #209 | Poor 35.7% |
Demographics Similar to Immigrants from Japan by In Labor Force | Age 16-19
In terms of in labor force | age 16-19, the demographic groups most similar to Immigrants from Japan are Bahamian (34.6%, a difference of 0.12%), Peruvian (34.6%, a difference of 0.16%), Immigrants from South Central Asia (34.6%, a difference of 0.26%), Immigrants from Egypt (34.6%, a difference of 0.27%), and Thai (34.6%, a difference of 0.28%).
| Demographics | Rating | Rank | In Labor Force | Age 16-19 |
| Immigrants | Sri Lanka | 2.4 /100 | #246 | Tragic 34.9% |
| Laotians | 2.4 /100 | #247 | Tragic 34.9% |
| Central Americans | 2.2 /100 | #248 | Tragic 34.8% |
| Immigrants | Ukraine | 2.2 /100 | #249 | Tragic 34.8% |
| Immigrants | Pakistan | 2.0 /100 | #250 | Tragic 34.8% |
| Immigrants | Western Asia | 2.0 /100 | #251 | Tragic 34.8% |
| Immigrants | Chile | 2.0 /100 | #252 | Tragic 34.8% |
| Immigrants | Japan | 1.5 /100 | #253 | Tragic 34.7% |
| Bahamians | 1.4 /100 | #254 | Tragic 34.6% |
| Peruvians | 1.4 /100 | #255 | Tragic 34.6% |
| Immigrants | South Central Asia | 1.3 /100 | #256 | Tragic 34.6% |
| Immigrants | Egypt | 1.2 /100 | #257 | Tragic 34.6% |
| Thais | 1.2 /100 | #258 | Tragic 34.6% |
| Immigrants | Immigrants | 1.2 /100 | #259 | Tragic 34.6% |
| Egyptians | 1.2 /100 | #260 | Tragic 34.5% |