Senegalese vs Immigrants from Guyana Doctorate Degree
COMPARE
Senegalese
Immigrants from Guyana
Doctorate Degree
Doctorate Degree Comparison
Senegalese
Immigrants from Guyana
2.0%
DOCTORATE DEGREE
86.7/ 100
METRIC RATING
141st/ 347
METRIC RANK
1.3%
DOCTORATE DEGREE
0.1/ 100
METRIC RATING
319th/ 347
METRIC RANK
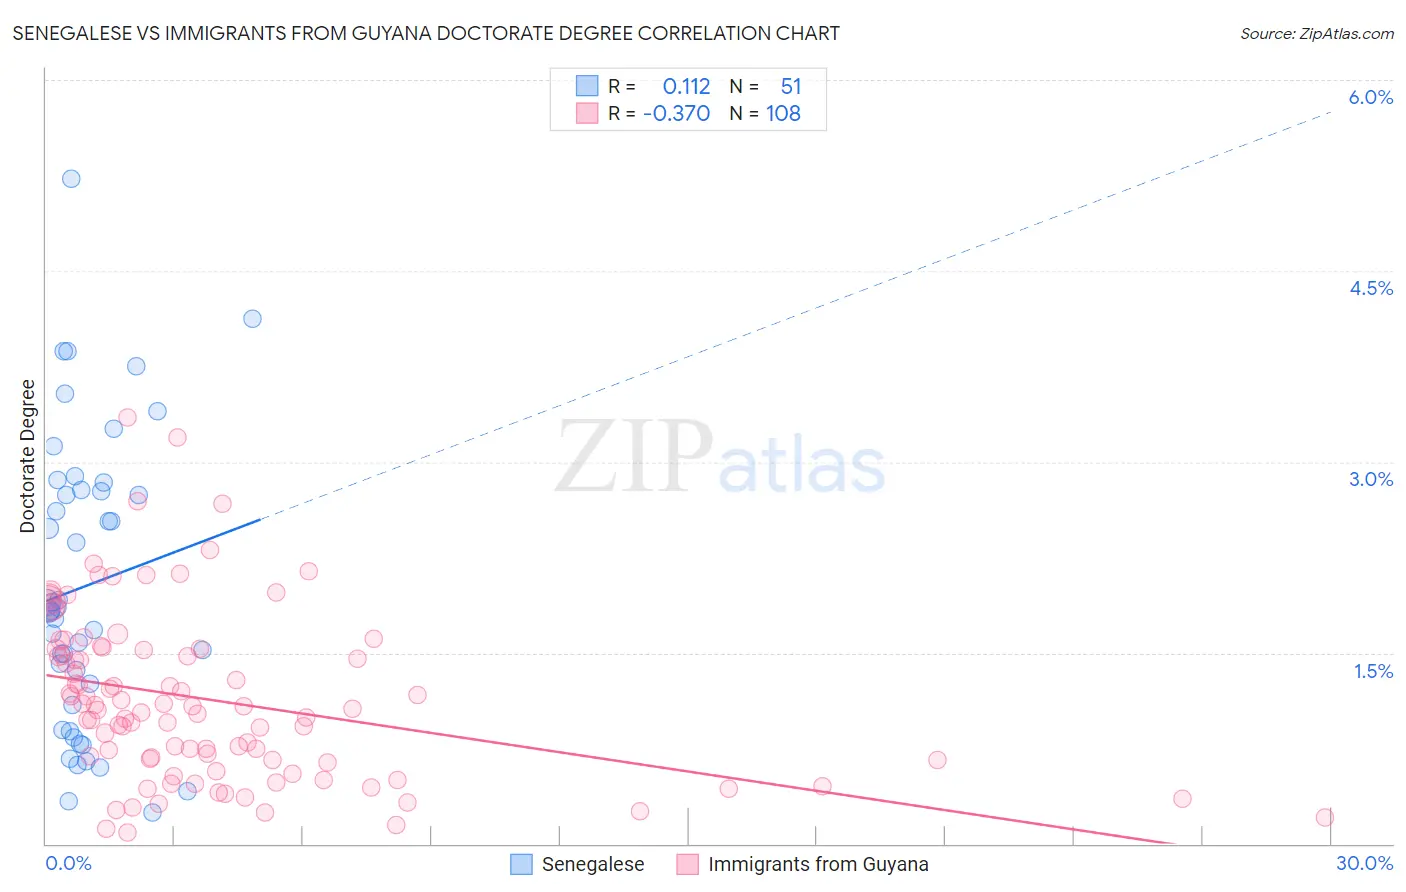
Senegalese vs Immigrants from Guyana Doctorate Degree Correlation Chart
The statistical analysis conducted on geographies consisting of 78,037,705 people shows a poor positive correlation between the proportion of Senegalese and percentage of population with at least doctorate degree education in the United States with a correlation coefficient (R) of 0.112 and weighted average of 2.0%. Similarly, the statistical analysis conducted on geographies consisting of 183,107,969 people shows a mild negative correlation between the proportion of Immigrants from Guyana and percentage of population with at least doctorate degree education in the United States with a correlation coefficient (R) of -0.370 and weighted average of 1.3%, a difference of 47.3%.
Doctorate Degree Correlation Summary
| Measurement | Senegalese | Immigrants from Guyana |
| Minimum | 0.24% | 0.090% |
| Maximum | 5.2% | 3.3% |
| Range | 5.0% | 3.3% |
| Mean | 2.0% | 1.1% |
| Median | 1.8% | 1.1% |
| Interquartile 25% (IQ1) | 1.1% | 0.65% |
| Interquartile 75% (IQ3) | 2.8% | 1.5% |
| Interquartile Range (IQR) | 1.7% | 0.88% |
| Standard Deviation (Sample) | 1.1% | 0.66% |
| Standard Deviation (Population) | 1.1% | 0.66% |
Similar Demographics by Doctorate Degree
Demographics Similar to Senegalese by Doctorate Degree
In terms of doctorate degree, the demographic groups most similar to Senegalese are Immigrants from Africa (2.0%, a difference of 0.070%), Afghan (2.0%, a difference of 0.16%), Italian (2.0%, a difference of 0.21%), Swiss (2.0%, a difference of 0.38%), and Sierra Leonean (2.0%, a difference of 0.46%).
| Demographics | Rating | Rank | Doctorate Degree |
| Immigrants | Cameroon | 88.9 /100 | #134 | Excellent 2.0% |
| Serbians | 88.7 /100 | #135 | Excellent 2.0% |
| Swedes | 88.3 /100 | #136 | Excellent 2.0% |
| South American Indians | 88.3 /100 | #137 | Excellent 2.0% |
| Swiss | 88.0 /100 | #138 | Excellent 2.0% |
| Afghans | 87.2 /100 | #139 | Excellent 2.0% |
| Immigrants | Africa | 87.0 /100 | #140 | Excellent 2.0% |
| Senegalese | 86.7 /100 | #141 | Excellent 2.0% |
| Italians | 86.0 /100 | #142 | Excellent 2.0% |
| Sierra Leoneans | 85.1 /100 | #143 | Excellent 2.0% |
| Immigrants | Moldova | 84.3 /100 | #144 | Excellent 2.0% |
| Kenyans | 83.6 /100 | #145 | Excellent 1.9% |
| Immigrants | Syria | 83.6 /100 | #146 | Excellent 1.9% |
| Immigrants | Senegal | 82.5 /100 | #147 | Excellent 1.9% |
| Luxembourgers | 81.1 /100 | #148 | Excellent 1.9% |
Demographics Similar to Immigrants from Guyana by Doctorate Degree
In terms of doctorate degree, the demographic groups most similar to Immigrants from Guyana are Immigrants from St. Vincent and the Grenadines (1.3%, a difference of 0.060%), Dutch West Indian (1.3%, a difference of 0.17%), Seminole (1.3%, a difference of 0.23%), Immigrants from Belize (1.3%, a difference of 0.43%), and Native/Alaskan (1.3%, a difference of 0.75%).
| Demographics | Rating | Rank | Doctorate Degree |
| Immigrants | Nicaragua | 0.1 /100 | #312 | Tragic 1.4% |
| Menominee | 0.1 /100 | #313 | Tragic 1.4% |
| Dominicans | 0.1 /100 | #314 | Tragic 1.4% |
| Immigrants | Azores | 0.1 /100 | #315 | Tragic 1.4% |
| Navajo | 0.1 /100 | #316 | Tragic 1.4% |
| Immigrants | Micronesia | 0.1 /100 | #317 | Tragic 1.3% |
| Creek | 0.1 /100 | #318 | Tragic 1.3% |
| Immigrants | Guyana | 0.1 /100 | #319 | Tragic 1.3% |
| Immigrants | St. Vincent and the Grenadines | 0.1 /100 | #320 | Tragic 1.3% |
| Dutch West Indians | 0.1 /100 | #321 | Tragic 1.3% |
| Seminole | 0.1 /100 | #322 | Tragic 1.3% |
| Immigrants | Belize | 0.1 /100 | #323 | Tragic 1.3% |
| Natives/Alaskans | 0.0 /100 | #324 | Tragic 1.3% |
| Pima | 0.0 /100 | #325 | Tragic 1.3% |
| Immigrants | Cabo Verde | 0.0 /100 | #326 | Tragic 1.3% |