Senegalese vs Immigrants from Japan 4th Grade
COMPARE
Senegalese
Immigrants from Japan
4th Grade
4th Grade Comparison
Senegalese
Immigrants from Japan
97.2%
4TH GRADE
3.1/ 100
METRIC RATING
233rd/ 347
METRIC RANK
97.8%
4TH GRADE
94.1/ 100
METRIC RATING
122nd/ 347
METRIC RANK
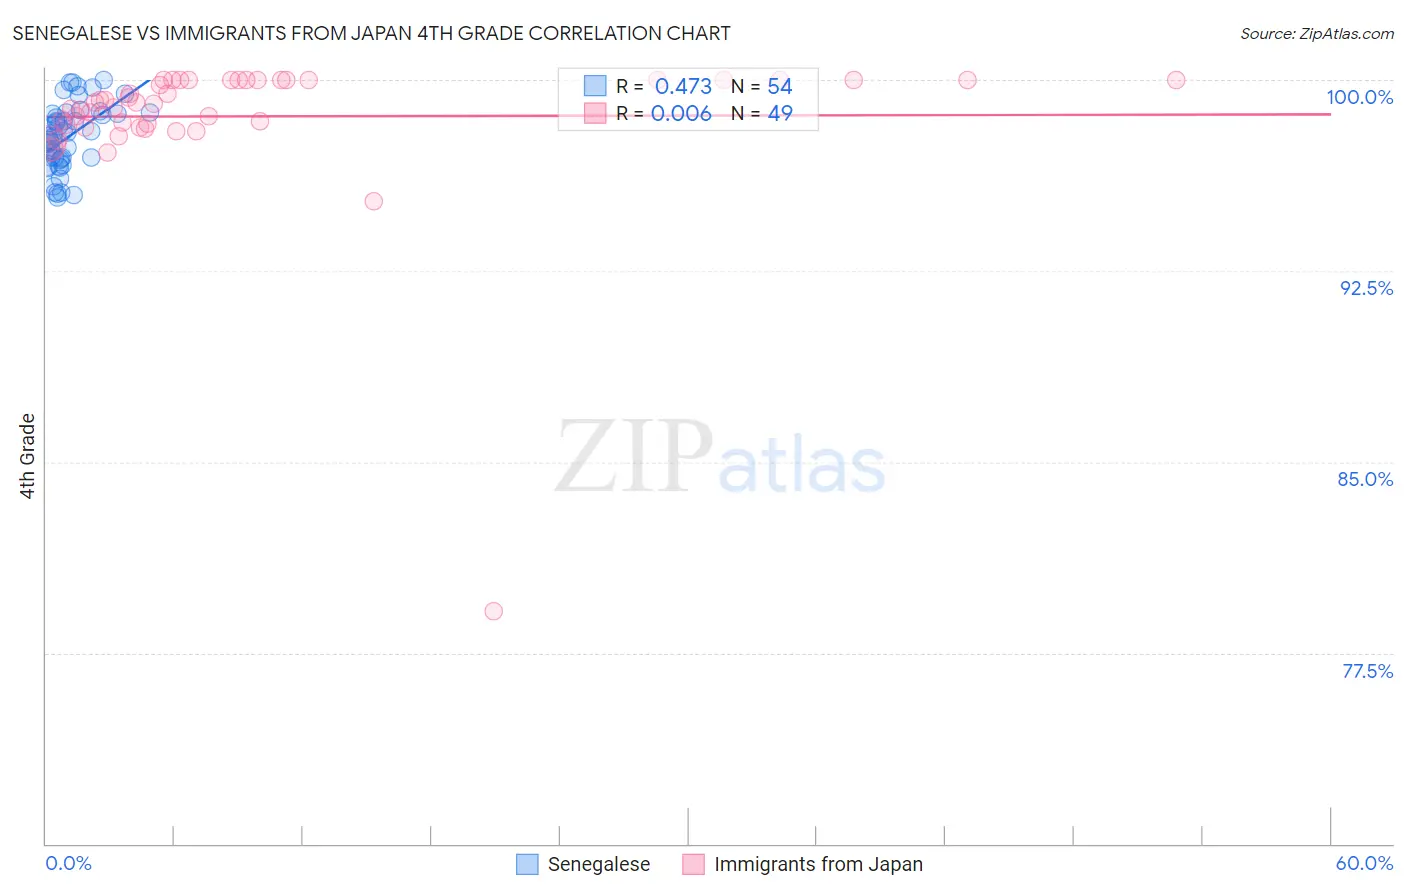
Senegalese vs Immigrants from Japan 4th Grade Correlation Chart
The statistical analysis conducted on geographies consisting of 78,142,569 people shows a moderate positive correlation between the proportion of Senegalese and percentage of population with at least 4th grade education in the United States with a correlation coefficient (R) of 0.473 and weighted average of 97.2%. Similarly, the statistical analysis conducted on geographies consisting of 340,148,942 people shows no correlation between the proportion of Immigrants from Japan and percentage of population with at least 4th grade education in the United States with a correlation coefficient (R) of 0.006 and weighted average of 97.8%, a difference of 0.59%.
4th Grade Correlation Summary
| Measurement | Senegalese | Immigrants from Japan |
| Minimum | 95.4% | 79.1% |
| Maximum | 100.0% | 100.0% |
| Range | 4.6% | 20.9% |
| Mean | 97.7% | 98.6% |
| Median | 97.8% | 99.1% |
| Interquartile 25% (IQ1) | 96.9% | 98.2% |
| Interquartile 75% (IQ3) | 98.6% | 100.0% |
| Interquartile Range (IQR) | 1.8% | 1.8% |
| Standard Deviation (Sample) | 1.3% | 3.0% |
| Standard Deviation (Population) | 1.2% | 3.0% |
Similar Demographics by 4th Grade
Demographics Similar to Senegalese by 4th Grade
In terms of 4th grade, the demographic groups most similar to Senegalese are Assyrian/Chaldean/Syriac (97.2%, a difference of 0.0%), Subsaharan African (97.2%, a difference of 0.010%), Liberian (97.2%, a difference of 0.010%), Uruguayan (97.2%, a difference of 0.010%), and Immigrants from Malaysia (97.2%, a difference of 0.010%).
| Demographics | Rating | Rank | 4th Grade |
| Bahamians | 3.8 /100 | #226 | Tragic 97.2% |
| Immigrants | Pakistan | 3.7 /100 | #227 | Tragic 97.2% |
| Sub-Saharan Africans | 3.6 /100 | #228 | Tragic 97.2% |
| Liberians | 3.6 /100 | #229 | Tragic 97.2% |
| Uruguayans | 3.5 /100 | #230 | Tragic 97.2% |
| Immigrants | Malaysia | 3.4 /100 | #231 | Tragic 97.2% |
| Immigrants | Western Asia | 3.4 /100 | #232 | Tragic 97.2% |
| Senegalese | 3.1 /100 | #233 | Tragic 97.2% |
| Assyrians/Chaldeans/Syriacs | 3.0 /100 | #234 | Tragic 97.2% |
| Yuman | 2.9 /100 | #235 | Tragic 97.2% |
| Immigrants | Eastern Asia | 2.7 /100 | #236 | Tragic 97.2% |
| Immigrants | Costa Rica | 2.0 /100 | #237 | Tragic 97.2% |
| Indians (Asian) | 1.9 /100 | #238 | Tragic 97.2% |
| Nigerians | 1.8 /100 | #239 | Tragic 97.1% |
| Colombians | 1.6 /100 | #240 | Tragic 97.1% |
Demographics Similar to Immigrants from Japan by 4th Grade
In terms of 4th grade, the demographic groups most similar to Immigrants from Japan are Immigrants from Norway (97.8%, a difference of 0.0%), Immigrants from Zimbabwe (97.8%, a difference of 0.0%), Syrian (97.8%, a difference of 0.010%), Menominee (97.8%, a difference of 0.010%), and Immigrants from Saudi Arabia (97.8%, a difference of 0.010%).
| Demographics | Rating | Rank | 4th Grade |
| Lebanese | 95.4 /100 | #115 | Exceptional 97.8% |
| Immigrants | Croatia | 95.2 /100 | #116 | Exceptional 97.8% |
| Syrians | 94.9 /100 | #117 | Exceptional 97.8% |
| Menominee | 94.9 /100 | #118 | Exceptional 97.8% |
| Immigrants | Saudi Arabia | 94.8 /100 | #119 | Exceptional 97.8% |
| Immigrants | France | 94.8 /100 | #120 | Exceptional 97.8% |
| Immigrants | Norway | 94.2 /100 | #121 | Exceptional 97.8% |
| Immigrants | Japan | 94.1 /100 | #122 | Exceptional 97.8% |
| Immigrants | Zimbabwe | 93.9 /100 | #123 | Exceptional 97.8% |
| Spanish | 93.7 /100 | #124 | Exceptional 97.8% |
| Immigrants | Serbia | 92.6 /100 | #125 | Exceptional 97.8% |
| Immigrants | Europe | 92.5 /100 | #126 | Exceptional 97.8% |
| Colville | 92.3 /100 | #127 | Exceptional 97.7% |
| Pima | 92.0 /100 | #128 | Exceptional 97.7% |
| Immigrants | Bulgaria | 91.3 /100 | #129 | Exceptional 97.7% |