Senegalese vs Bahamian Doctorate Degree
COMPARE
Senegalese
Bahamian
Doctorate Degree
Doctorate Degree Comparison
Senegalese
Bahamians
2.0%
DOCTORATE DEGREE
86.7/ 100
METRIC RATING
141st/ 347
METRIC RANK
1.5%
DOCTORATE DEGREE
0.4/ 100
METRIC RATING
277th/ 347
METRIC RANK
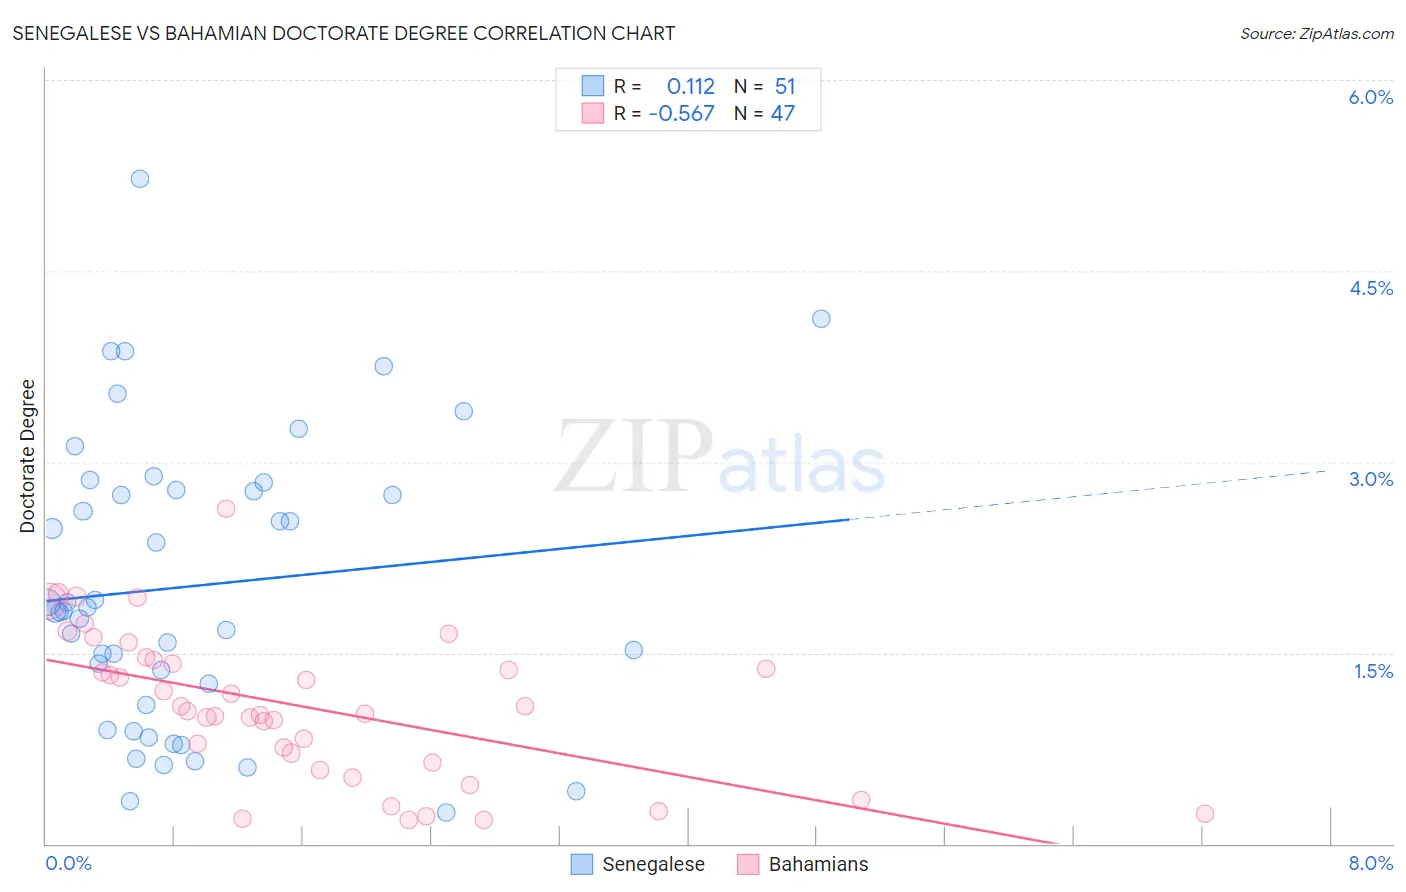
Senegalese vs Bahamian Doctorate Degree Correlation Chart
The statistical analysis conducted on geographies consisting of 78,037,705 people shows a poor positive correlation between the proportion of Senegalese and percentage of population with at least doctorate degree education in the United States with a correlation coefficient (R) of 0.112 and weighted average of 2.0%. Similarly, the statistical analysis conducted on geographies consisting of 112,287,589 people shows a substantial negative correlation between the proportion of Bahamians and percentage of population with at least doctorate degree education in the United States with a correlation coefficient (R) of -0.567 and weighted average of 1.5%, a difference of 34.3%.
Doctorate Degree Correlation Summary
| Measurement | Senegalese | Bahamian |
| Minimum | 0.24% | 0.18% |
| Maximum | 5.2% | 2.6% |
| Range | 5.0% | 2.5% |
| Mean | 2.0% | 1.1% |
| Median | 1.8% | 1.0% |
| Interquartile 25% (IQ1) | 1.1% | 0.64% |
| Interquartile 75% (IQ3) | 2.8% | 1.4% |
| Interquartile Range (IQR) | 1.7% | 0.80% |
| Standard Deviation (Sample) | 1.1% | 0.57% |
| Standard Deviation (Population) | 1.1% | 0.57% |
Similar Demographics by Doctorate Degree
Demographics Similar to Senegalese by Doctorate Degree
In terms of doctorate degree, the demographic groups most similar to Senegalese are Immigrants from Africa (2.0%, a difference of 0.070%), Afghan (2.0%, a difference of 0.16%), Italian (2.0%, a difference of 0.21%), Swiss (2.0%, a difference of 0.38%), and Sierra Leonean (2.0%, a difference of 0.46%).
| Demographics | Rating | Rank | Doctorate Degree |
| Immigrants | Cameroon | 88.9 /100 | #134 | Excellent 2.0% |
| Serbians | 88.7 /100 | #135 | Excellent 2.0% |
| Swedes | 88.3 /100 | #136 | Excellent 2.0% |
| South American Indians | 88.3 /100 | #137 | Excellent 2.0% |
| Swiss | 88.0 /100 | #138 | Excellent 2.0% |
| Afghans | 87.2 /100 | #139 | Excellent 2.0% |
| Immigrants | Africa | 87.0 /100 | #140 | Excellent 2.0% |
| Senegalese | 86.7 /100 | #141 | Excellent 2.0% |
| Italians | 86.0 /100 | #142 | Excellent 2.0% |
| Sierra Leoneans | 85.1 /100 | #143 | Excellent 2.0% |
| Immigrants | Moldova | 84.3 /100 | #144 | Excellent 2.0% |
| Kenyans | 83.6 /100 | #145 | Excellent 1.9% |
| Immigrants | Syria | 83.6 /100 | #146 | Excellent 1.9% |
| Immigrants | Senegal | 82.5 /100 | #147 | Excellent 1.9% |
| Luxembourgers | 81.1 /100 | #148 | Excellent 1.9% |
Demographics Similar to Bahamians by Doctorate Degree
In terms of doctorate degree, the demographic groups most similar to Bahamians are Hawaiian (1.5%, a difference of 0.060%), Marshallese (1.5%, a difference of 0.28%), Ecuadorian (1.5%, a difference of 0.29%), Tohono O'odham (1.5%, a difference of 0.35%), and British West Indian (1.5%, a difference of 0.41%).
| Demographics | Rating | Rank | Doctorate Degree |
| Salvadorans | 0.5 /100 | #270 | Tragic 1.5% |
| Immigrants | Trinidad and Tobago | 0.5 /100 | #271 | Tragic 1.5% |
| Immigrants | Barbados | 0.4 /100 | #272 | Tragic 1.5% |
| Sioux | 0.4 /100 | #273 | Tragic 1.5% |
| Yaqui | 0.4 /100 | #274 | Tragic 1.5% |
| Aleuts | 0.4 /100 | #275 | Tragic 1.5% |
| Paiute | 0.4 /100 | #276 | Tragic 1.5% |
| Bahamians | 0.4 /100 | #277 | Tragic 1.5% |
| Hawaiians | 0.4 /100 | #278 | Tragic 1.5% |
| Marshallese | 0.4 /100 | #279 | Tragic 1.5% |
| Ecuadorians | 0.4 /100 | #280 | Tragic 1.5% |
| Tohono O'odham | 0.4 /100 | #281 | Tragic 1.5% |
| British West Indians | 0.3 /100 | #282 | Tragic 1.5% |
| Central Americans | 0.3 /100 | #283 | Tragic 1.5% |
| Jamaicans | 0.3 /100 | #284 | Tragic 1.5% |