Senegalese vs Cambodian Doctorate Degree
COMPARE
Senegalese
Cambodian
Doctorate Degree
Doctorate Degree Comparison
Senegalese
Cambodians
2.0%
DOCTORATE DEGREE
86.7/ 100
METRIC RATING
141st/ 347
METRIC RANK
2.6%
DOCTORATE DEGREE
100.0/ 100
METRIC RATING
33rd/ 347
METRIC RANK
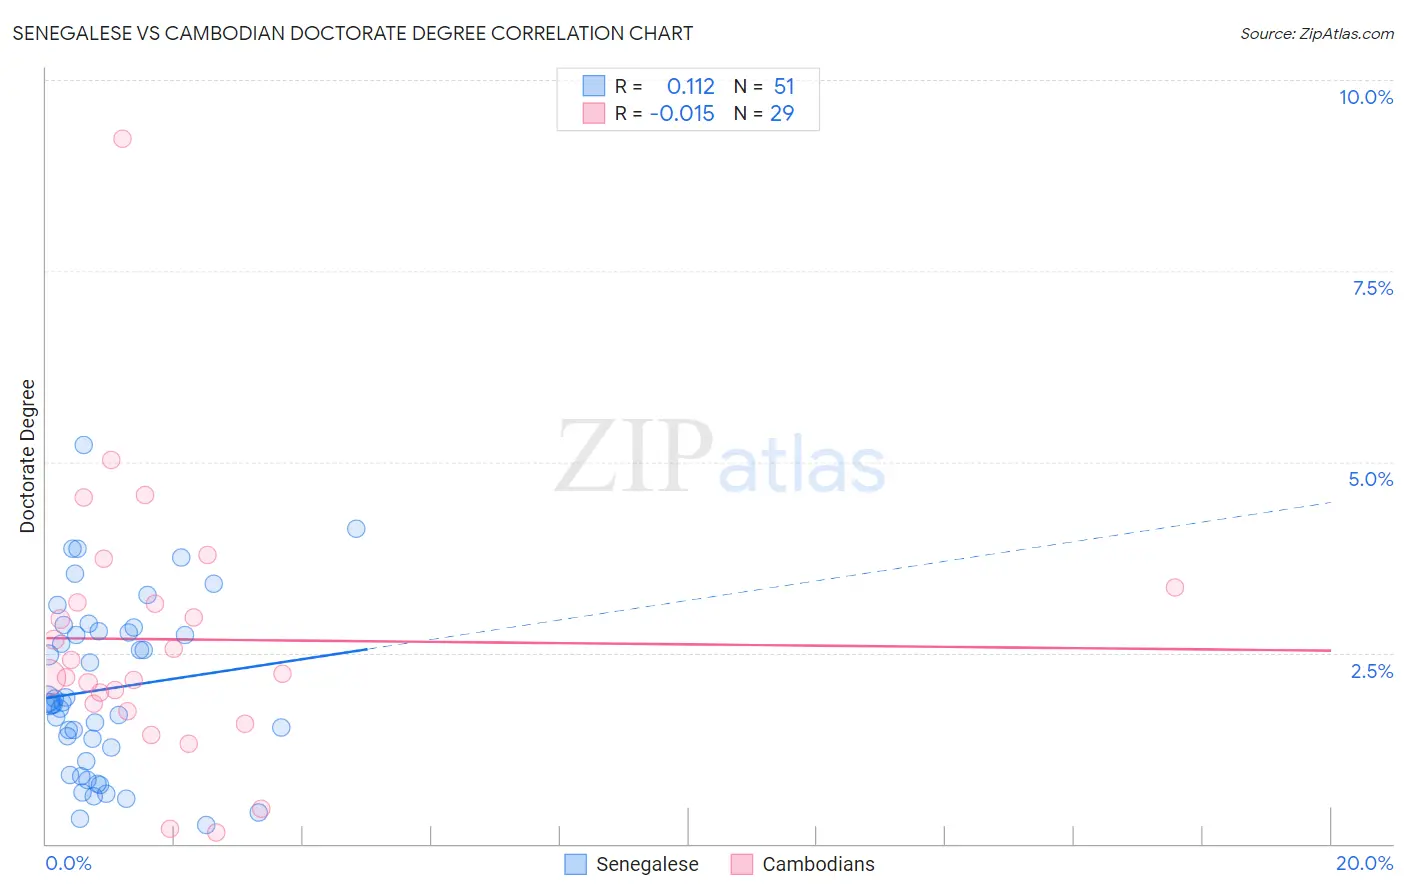
Senegalese vs Cambodian Doctorate Degree Correlation Chart
The statistical analysis conducted on geographies consisting of 78,037,705 people shows a poor positive correlation between the proportion of Senegalese and percentage of population with at least doctorate degree education in the United States with a correlation coefficient (R) of 0.112 and weighted average of 2.0%. Similarly, the statistical analysis conducted on geographies consisting of 102,342,908 people shows no correlation between the proportion of Cambodians and percentage of population with at least doctorate degree education in the United States with a correlation coefficient (R) of -0.015 and weighted average of 2.6%, a difference of 30.7%.
Doctorate Degree Correlation Summary
| Measurement | Senegalese | Cambodian |
| Minimum | 0.24% | 0.15% |
| Maximum | 5.2% | 9.2% |
| Range | 5.0% | 9.1% |
| Mean | 2.0% | 2.7% |
| Median | 1.8% | 2.2% |
| Interquartile 25% (IQ1) | 1.1% | 1.8% |
| Interquartile 75% (IQ3) | 2.8% | 3.3% |
| Interquartile Range (IQR) | 1.7% | 1.5% |
| Standard Deviation (Sample) | 1.1% | 1.7% |
| Standard Deviation (Population) | 1.1% | 1.7% |
Similar Demographics by Doctorate Degree
Demographics Similar to Senegalese by Doctorate Degree
In terms of doctorate degree, the demographic groups most similar to Senegalese are Immigrants from Africa (2.0%, a difference of 0.070%), Afghan (2.0%, a difference of 0.16%), Italian (2.0%, a difference of 0.21%), Swiss (2.0%, a difference of 0.38%), and Sierra Leonean (2.0%, a difference of 0.46%).
| Demographics | Rating | Rank | Doctorate Degree |
| Immigrants | Cameroon | 88.9 /100 | #134 | Excellent 2.0% |
| Serbians | 88.7 /100 | #135 | Excellent 2.0% |
| Swedes | 88.3 /100 | #136 | Excellent 2.0% |
| South American Indians | 88.3 /100 | #137 | Excellent 2.0% |
| Swiss | 88.0 /100 | #138 | Excellent 2.0% |
| Afghans | 87.2 /100 | #139 | Excellent 2.0% |
| Immigrants | Africa | 87.0 /100 | #140 | Excellent 2.0% |
| Senegalese | 86.7 /100 | #141 | Excellent 2.0% |
| Italians | 86.0 /100 | #142 | Excellent 2.0% |
| Sierra Leoneans | 85.1 /100 | #143 | Excellent 2.0% |
| Immigrants | Moldova | 84.3 /100 | #144 | Excellent 2.0% |
| Kenyans | 83.6 /100 | #145 | Excellent 1.9% |
| Immigrants | Syria | 83.6 /100 | #146 | Excellent 1.9% |
| Immigrants | Senegal | 82.5 /100 | #147 | Excellent 1.9% |
| Luxembourgers | 81.1 /100 | #148 | Excellent 1.9% |
Demographics Similar to Cambodians by Doctorate Degree
In terms of doctorate degree, the demographic groups most similar to Cambodians are Cypriot (2.6%, a difference of 0.11%), Immigrants from Northern Europe (2.6%, a difference of 0.17%), Immigrants from Malaysia (2.6%, a difference of 0.17%), Immigrants from Spain (2.6%, a difference of 0.23%), and Latvian (2.6%, a difference of 0.33%).
| Demographics | Rating | Rank | Doctorate Degree |
| Turks | 100.0 /100 | #26 | Exceptional 2.7% |
| Immigrants | Turkey | 100.0 /100 | #27 | Exceptional 2.6% |
| Burmese | 100.0 /100 | #28 | Exceptional 2.6% |
| Immigrants | South Central Asia | 100.0 /100 | #29 | Exceptional 2.6% |
| Immigrants | Korea | 100.0 /100 | #30 | Exceptional 2.6% |
| Latvians | 100.0 /100 | #31 | Exceptional 2.6% |
| Immigrants | Northern Europe | 100.0 /100 | #32 | Exceptional 2.6% |
| Cambodians | 100.0 /100 | #33 | Exceptional 2.6% |
| Cypriots | 100.0 /100 | #34 | Exceptional 2.6% |
| Immigrants | Malaysia | 100.0 /100 | #35 | Exceptional 2.6% |
| Immigrants | Spain | 100.0 /100 | #36 | Exceptional 2.6% |
| Immigrants | Kuwait | 100.0 /100 | #37 | Exceptional 2.6% |
| Russians | 100.0 /100 | #38 | Exceptional 2.6% |
| Immigrants | Ireland | 100.0 /100 | #39 | Exceptional 2.5% |
| Estonians | 100.0 /100 | #40 | Exceptional 2.5% |