Immigrants from Spain vs Immigrants from Japan Doctorate Degree
COMPARE
Immigrants from Spain
Immigrants from Japan
Doctorate Degree
Doctorate Degree Comparison
Immigrants from Spain
Immigrants from Japan
2.6%
DOCTORATE DEGREE
100.0/ 100
METRIC RATING
36th/ 347
METRIC RANK
2.8%
DOCTORATE DEGREE
100.0/ 100
METRIC RATING
19th/ 347
METRIC RANK
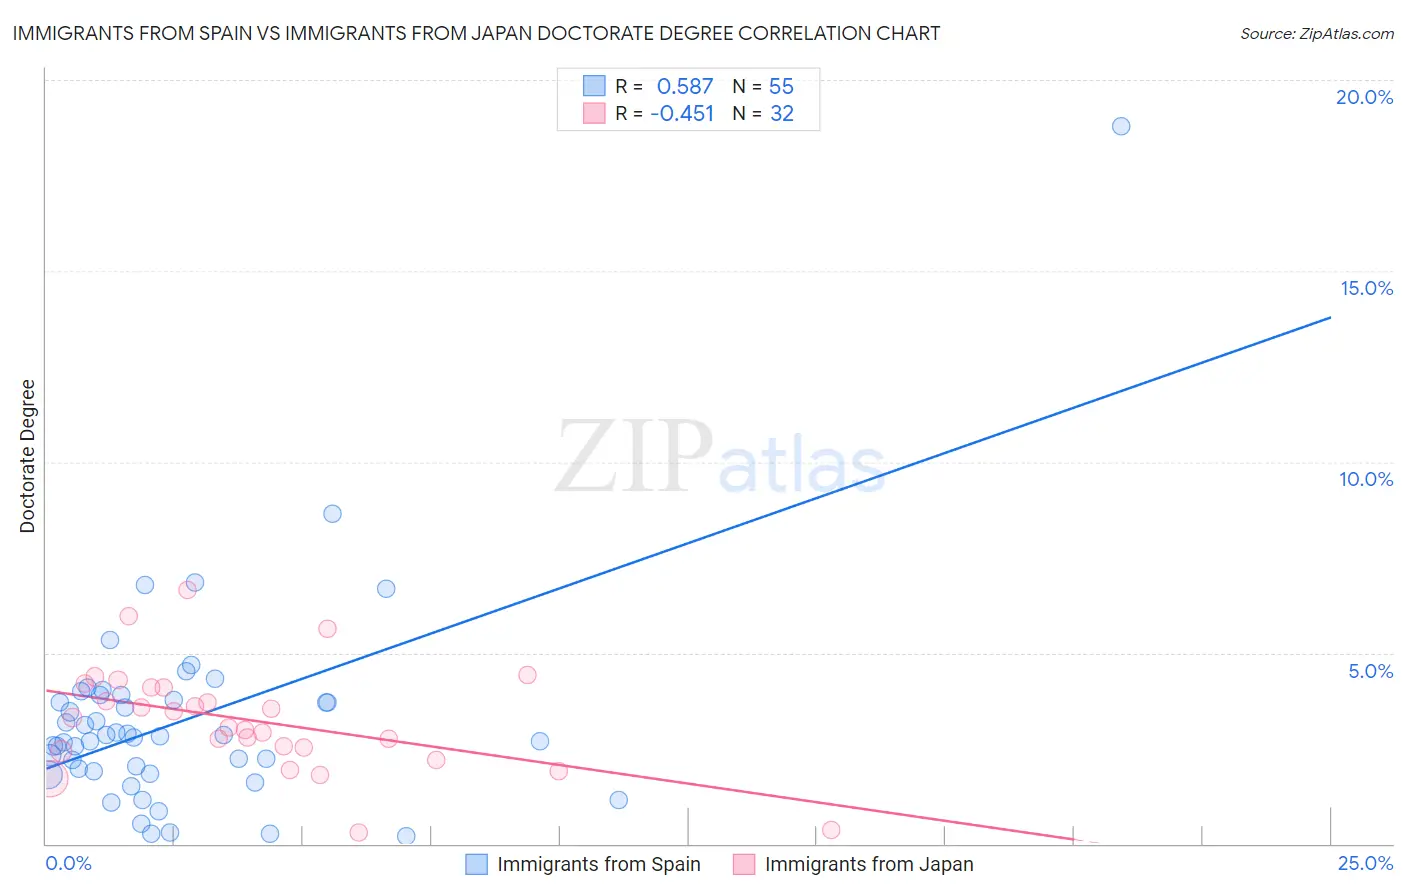
Immigrants from Spain vs Immigrants from Japan Doctorate Degree Correlation Chart
The statistical analysis conducted on geographies consisting of 238,840,570 people shows a substantial positive correlation between the proportion of Immigrants from Spain and percentage of population with at least doctorate degree education in the United States with a correlation coefficient (R) of 0.587 and weighted average of 2.6%. Similarly, the statistical analysis conducted on geographies consisting of 338,241,347 people shows a moderate negative correlation between the proportion of Immigrants from Japan and percentage of population with at least doctorate degree education in the United States with a correlation coefficient (R) of -0.451 and weighted average of 2.8%, a difference of 8.7%.
Doctorate Degree Correlation Summary
| Measurement | Immigrants from Spain | Immigrants from Japan |
| Minimum | 0.19% | 0.28% |
| Maximum | 18.8% | 6.6% |
| Range | 18.6% | 6.4% |
| Mean | 3.2% | 3.2% |
| Median | 2.8% | 3.2% |
| Interquartile 25% (IQ1) | 1.9% | 2.5% |
| Interquartile 75% (IQ3) | 3.9% | 4.1% |
| Interquartile Range (IQR) | 2.0% | 1.6% |
| Standard Deviation (Sample) | 2.7% | 1.4% |
| Standard Deviation (Population) | 2.7% | 1.4% |
Demographics Similar to Immigrants from Spain and Immigrants from Japan by Doctorate Degree
In terms of doctorate degree, the demographic groups most similar to Immigrants from Spain are Immigrants from Malaysia (2.6%, a difference of 0.060%), Cypriot (2.6%, a difference of 0.12%), Cambodian (2.6%, a difference of 0.23%), Immigrants from Kuwait (2.6%, a difference of 0.26%), and Immigrants from Northern Europe (2.6%, a difference of 0.41%). Similarly, the demographic groups most similar to Immigrants from Japan are Immigrants from Hong Kong (2.8%, a difference of 0.35%), Immigrants from Sri Lanka (2.8%, a difference of 0.37%), Immigrants from Australia (2.8%, a difference of 0.62%), Thai (2.8%, a difference of 0.70%), and Mongolian (2.8%, a difference of 0.91%).
| Demographics | Rating | Rank | Doctorate Degree |
| Immigrants | Australia | 100.0 /100 | #17 | Exceptional 2.8% |
| Immigrants | Sri Lanka | 100.0 /100 | #18 | Exceptional 2.8% |
| Immigrants | Japan | 100.0 /100 | #19 | Exceptional 2.8% |
| Immigrants | Hong Kong | 100.0 /100 | #20 | Exceptional 2.8% |
| Thais | 100.0 /100 | #21 | Exceptional 2.8% |
| Mongolians | 100.0 /100 | #22 | Exceptional 2.8% |
| Immigrants | Denmark | 100.0 /100 | #23 | Exceptional 2.8% |
| Israelis | 100.0 /100 | #24 | Exceptional 2.7% |
| Immigrants | Saudi Arabia | 100.0 /100 | #25 | Exceptional 2.7% |
| Turks | 100.0 /100 | #26 | Exceptional 2.7% |
| Immigrants | Turkey | 100.0 /100 | #27 | Exceptional 2.6% |
| Burmese | 100.0 /100 | #28 | Exceptional 2.6% |
| Immigrants | South Central Asia | 100.0 /100 | #29 | Exceptional 2.6% |
| Immigrants | Korea | 100.0 /100 | #30 | Exceptional 2.6% |
| Latvians | 100.0 /100 | #31 | Exceptional 2.6% |
| Immigrants | Northern Europe | 100.0 /100 | #32 | Exceptional 2.6% |
| Cambodians | 100.0 /100 | #33 | Exceptional 2.6% |
| Cypriots | 100.0 /100 | #34 | Exceptional 2.6% |
| Immigrants | Malaysia | 100.0 /100 | #35 | Exceptional 2.6% |
| Immigrants | Spain | 100.0 /100 | #36 | Exceptional 2.6% |
| Immigrants | Kuwait | 100.0 /100 | #37 | Exceptional 2.6% |