Mongolian vs Immigrants from Haiti Master's Degree
COMPARE
Mongolian
Immigrants from Haiti
Master's Degree
Master's Degree Comparison
Mongolians
Immigrants from Haiti
19.4%
MASTER'S DEGREE
100.0/ 100
METRIC RATING
37th/ 347
METRIC RANK
11.8%
MASTER'S DEGREE
0.1/ 100
METRIC RATING
287th/ 347
METRIC RANK
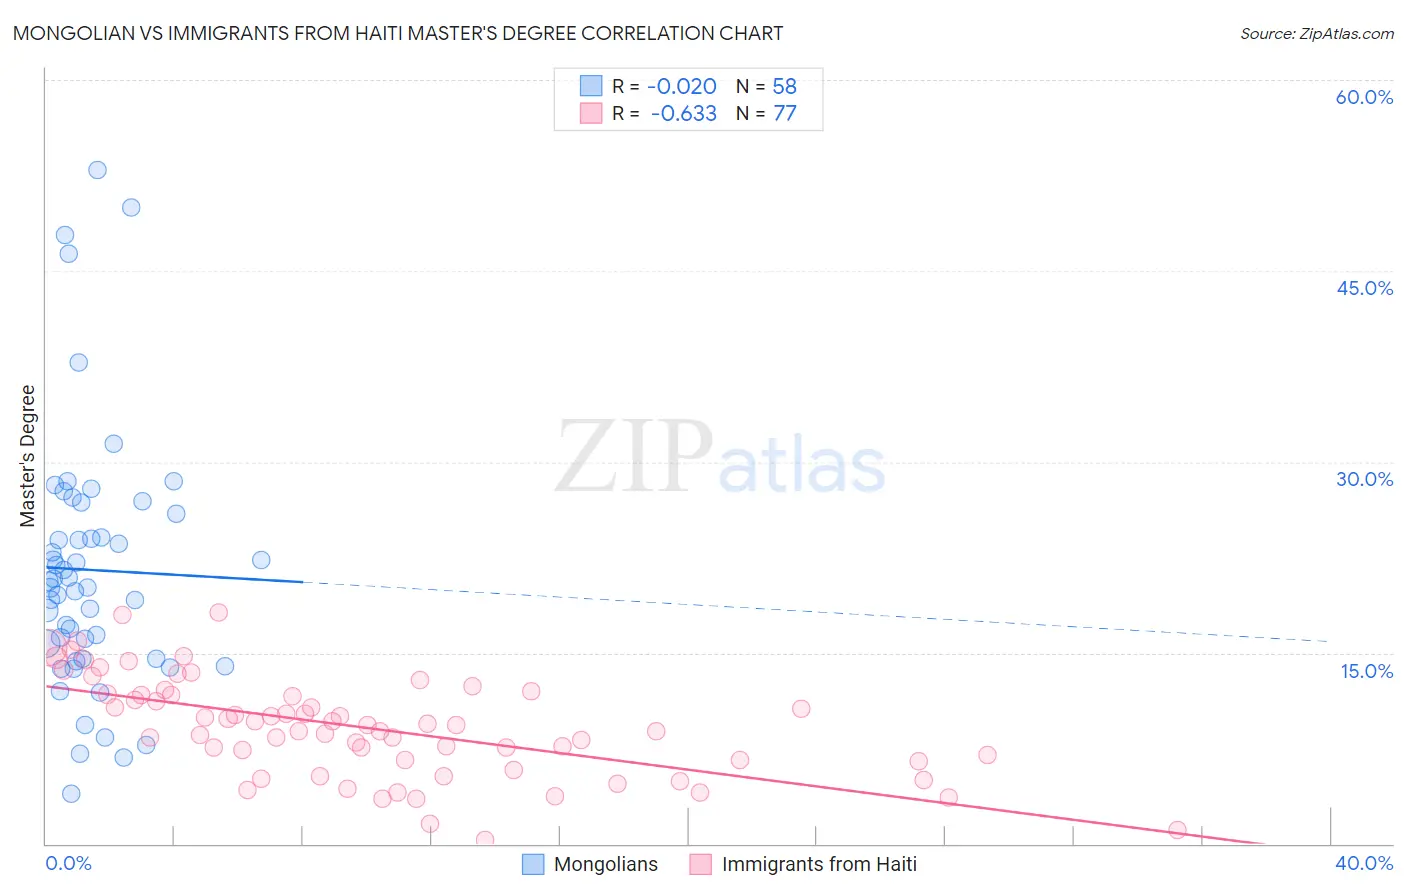
Mongolian vs Immigrants from Haiti Master's Degree Correlation Chart
The statistical analysis conducted on geographies consisting of 140,335,319 people shows no correlation between the proportion of Mongolians and percentage of population with at least master's degree education in the United States with a correlation coefficient (R) of -0.020 and weighted average of 19.4%. Similarly, the statistical analysis conducted on geographies consisting of 225,216,458 people shows a significant negative correlation between the proportion of Immigrants from Haiti and percentage of population with at least master's degree education in the United States with a correlation coefficient (R) of -0.633 and weighted average of 11.8%, a difference of 64.7%.
Master's Degree Correlation Summary
| Measurement | Mongolian | Immigrants from Haiti |
| Minimum | 3.9% | 0.34% |
| Maximum | 53.0% | 18.2% |
| Range | 49.0% | 17.8% |
| Mean | 21.5% | 9.1% |
| Median | 20.4% | 9.3% |
| Interquartile 25% (IQ1) | 14.5% | 6.5% |
| Interquartile 75% (IQ3) | 26.0% | 11.7% |
| Interquartile Range (IQR) | 11.4% | 5.2% |
| Standard Deviation (Sample) | 10.1% | 3.9% |
| Standard Deviation (Population) | 10.0% | 3.9% |
Similar Demographics by Master's Degree
Demographics Similar to Mongolians by Master's Degree
In terms of master's degree, the demographic groups most similar to Mongolians are Immigrants from Russia (19.4%, a difference of 0.040%), Immigrants from Northern Europe (19.5%, a difference of 0.41%), Bolivian (19.3%, a difference of 0.69%), Immigrants from Denmark (19.5%, a difference of 0.74%), and Russian (19.5%, a difference of 0.77%).
| Demographics | Rating | Rank | Master's Degree |
| Immigrants | Turkey | 100.0 /100 | #30 | Exceptional 19.7% |
| Immigrants | Korea | 100.0 /100 | #31 | Exceptional 19.7% |
| Burmese | 100.0 /100 | #32 | Exceptional 19.7% |
| Russians | 100.0 /100 | #33 | Exceptional 19.5% |
| Immigrants | Denmark | 100.0 /100 | #34 | Exceptional 19.5% |
| Immigrants | Northern Europe | 100.0 /100 | #35 | Exceptional 19.5% |
| Immigrants | Russia | 100.0 /100 | #36 | Exceptional 19.4% |
| Mongolians | 100.0 /100 | #37 | Exceptional 19.4% |
| Bolivians | 100.0 /100 | #38 | Exceptional 19.3% |
| Immigrants | Spain | 100.0 /100 | #39 | Exceptional 19.1% |
| Immigrants | Bolivia | 100.0 /100 | #40 | Exceptional 19.1% |
| Immigrants | Latvia | 100.0 /100 | #41 | Exceptional 19.1% |
| Immigrants | Saudi Arabia | 100.0 /100 | #42 | Exceptional 19.0% |
| Immigrants | Greece | 100.0 /100 | #43 | Exceptional 19.0% |
| Immigrants | Malaysia | 100.0 /100 | #44 | Exceptional 18.9% |
Demographics Similar to Immigrants from Haiti by Master's Degree
In terms of master's degree, the demographic groups most similar to Immigrants from Haiti are Immigrants from Honduras (11.8%, a difference of 0.17%), Aleut (11.8%, a difference of 0.20%), Guatemalan (11.7%, a difference of 0.25%), Ute (11.7%, a difference of 0.49%), and Immigrants from Nicaragua (11.8%, a difference of 0.55%).
| Demographics | Rating | Rank | Master's Degree |
| Immigrants | Dominican Republic | 0.2 /100 | #280 | Tragic 12.1% |
| Malaysians | 0.2 /100 | #281 | Tragic 12.0% |
| Immigrants | El Salvador | 0.2 /100 | #282 | Tragic 12.0% |
| Hondurans | 0.2 /100 | #283 | Tragic 11.9% |
| Ottawa | 0.2 /100 | #284 | Tragic 11.9% |
| Immigrants | Nicaragua | 0.2 /100 | #285 | Tragic 11.8% |
| Aleuts | 0.1 /100 | #286 | Tragic 11.8% |
| Immigrants | Haiti | 0.1 /100 | #287 | Tragic 11.8% |
| Immigrants | Honduras | 0.1 /100 | #288 | Tragic 11.8% |
| Guatemalans | 0.1 /100 | #289 | Tragic 11.7% |
| Ute | 0.1 /100 | #290 | Tragic 11.7% |
| Colville | 0.1 /100 | #291 | Tragic 11.6% |
| Immigrants | Guatemala | 0.1 /100 | #292 | Tragic 11.6% |
| Alaska Natives | 0.1 /100 | #293 | Tragic 11.6% |
| Hawaiians | 0.1 /100 | #294 | Tragic 11.6% |