Seminole vs Immigrants from Haiti Master's Degree
COMPARE
Seminole
Immigrants from Haiti
Master's Degree
Master's Degree Comparison
Seminole
Immigrants from Haiti
11.0%
MASTER'S DEGREE
0.0/ 100
METRIC RATING
311th/ 347
METRIC RANK
11.8%
MASTER'S DEGREE
0.1/ 100
METRIC RATING
287th/ 347
METRIC RANK
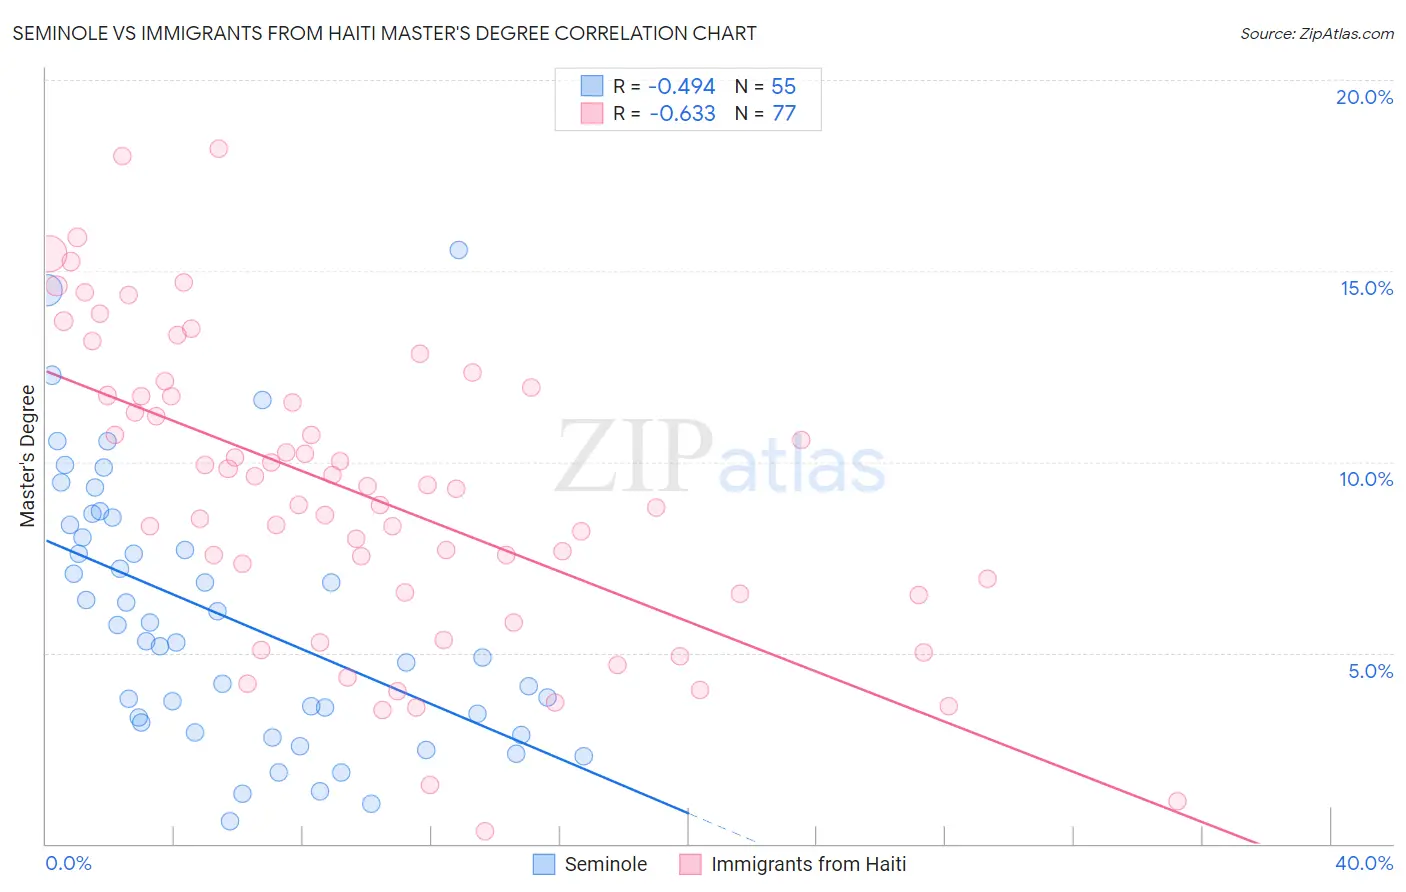
Seminole vs Immigrants from Haiti Master's Degree Correlation Chart
The statistical analysis conducted on geographies consisting of 118,305,652 people shows a moderate negative correlation between the proportion of Seminole and percentage of population with at least master's degree education in the United States with a correlation coefficient (R) of -0.494 and weighted average of 11.0%. Similarly, the statistical analysis conducted on geographies consisting of 225,216,458 people shows a significant negative correlation between the proportion of Immigrants from Haiti and percentage of population with at least master's degree education in the United States with a correlation coefficient (R) of -0.633 and weighted average of 11.8%, a difference of 6.7%.
Master's Degree Correlation Summary
| Measurement | Seminole | Immigrants from Haiti |
| Minimum | 0.60% | 0.34% |
| Maximum | 15.6% | 18.2% |
| Range | 15.0% | 17.8% |
| Mean | 5.9% | 9.1% |
| Median | 5.3% | 9.3% |
| Interquartile 25% (IQ1) | 3.2% | 6.5% |
| Interquartile 75% (IQ3) | 8.4% | 11.7% |
| Interquartile Range (IQR) | 5.2% | 5.2% |
| Standard Deviation (Sample) | 3.5% | 3.9% |
| Standard Deviation (Population) | 3.4% | 3.9% |
Similar Demographics by Master's Degree
Demographics Similar to Seminole by Master's Degree
In terms of master's degree, the demographic groups most similar to Seminole are Choctaw (11.0%, a difference of 0.10%), Yaqui (11.0%, a difference of 0.27%), Shoshone (11.1%, a difference of 0.51%), Cajun (11.0%, a difference of 0.67%), and Apache (11.0%, a difference of 0.67%).
| Demographics | Rating | Rank | Master's Degree |
| Immigrants | Cabo Verde | 0.1 /100 | #304 | Tragic 11.3% |
| Immigrants | Latin America | 0.0 /100 | #305 | Tragic 11.3% |
| Mexican American Indians | 0.0 /100 | #306 | Tragic 11.2% |
| Cheyenne | 0.0 /100 | #307 | Tragic 11.2% |
| Puerto Ricans | 0.0 /100 | #308 | Tragic 11.2% |
| Puget Sound Salish | 0.0 /100 | #309 | Tragic 11.1% |
| Shoshone | 0.0 /100 | #310 | Tragic 11.1% |
| Seminole | 0.0 /100 | #311 | Tragic 11.0% |
| Choctaw | 0.0 /100 | #312 | Tragic 11.0% |
| Yaqui | 0.0 /100 | #313 | Tragic 11.0% |
| Cajuns | 0.0 /100 | #314 | Tragic 11.0% |
| Apache | 0.0 /100 | #315 | Tragic 11.0% |
| Hispanics or Latinos | 0.0 /100 | #316 | Tragic 10.9% |
| Hopi | 0.0 /100 | #317 | Tragic 10.9% |
| Immigrants | Cuba | 0.0 /100 | #318 | Tragic 10.9% |
Demographics Similar to Immigrants from Haiti by Master's Degree
In terms of master's degree, the demographic groups most similar to Immigrants from Haiti are Immigrants from Honduras (11.8%, a difference of 0.17%), Aleut (11.8%, a difference of 0.20%), Guatemalan (11.7%, a difference of 0.25%), Ute (11.7%, a difference of 0.49%), and Immigrants from Nicaragua (11.8%, a difference of 0.55%).
| Demographics | Rating | Rank | Master's Degree |
| Immigrants | Dominican Republic | 0.2 /100 | #280 | Tragic 12.1% |
| Malaysians | 0.2 /100 | #281 | Tragic 12.0% |
| Immigrants | El Salvador | 0.2 /100 | #282 | Tragic 12.0% |
| Hondurans | 0.2 /100 | #283 | Tragic 11.9% |
| Ottawa | 0.2 /100 | #284 | Tragic 11.9% |
| Immigrants | Nicaragua | 0.2 /100 | #285 | Tragic 11.8% |
| Aleuts | 0.1 /100 | #286 | Tragic 11.8% |
| Immigrants | Haiti | 0.1 /100 | #287 | Tragic 11.8% |
| Immigrants | Honduras | 0.1 /100 | #288 | Tragic 11.8% |
| Guatemalans | 0.1 /100 | #289 | Tragic 11.7% |
| Ute | 0.1 /100 | #290 | Tragic 11.7% |
| Colville | 0.1 /100 | #291 | Tragic 11.6% |
| Immigrants | Guatemala | 0.1 /100 | #292 | Tragic 11.6% |
| Alaska Natives | 0.1 /100 | #293 | Tragic 11.6% |
| Hawaiians | 0.1 /100 | #294 | Tragic 11.6% |