Immigrants from Germany vs Tlingit-Haida 10th Grade
COMPARE
Immigrants from Germany
Tlingit-Haida
10th Grade
10th Grade Comparison
Immigrants from Germany
Tlingit-Haida
94.6%
10TH GRADE
98.3/ 100
METRIC RATING
94th/ 347
METRIC RANK
95.7%
10TH GRADE
100.0/ 100
METRIC RATING
12th/ 347
METRIC RANK
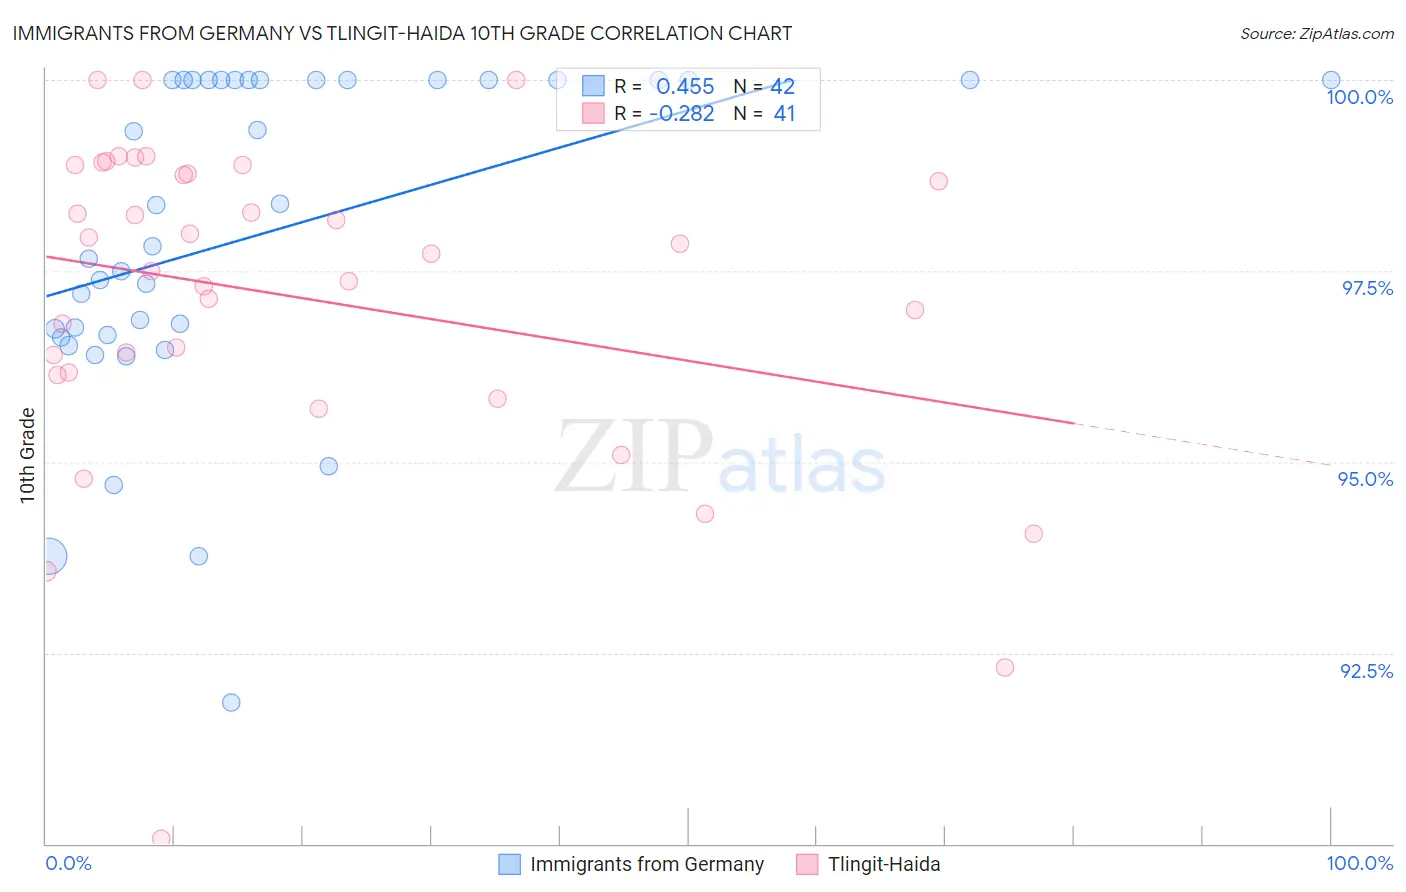
Immigrants from Germany vs Tlingit-Haida 10th Grade Correlation Chart
The statistical analysis conducted on geographies consisting of 463,886,920 people shows a moderate positive correlation between the proportion of Immigrants from Germany and percentage of population with at least 10th grade education in the United States with a correlation coefficient (R) of 0.455 and weighted average of 94.6%. Similarly, the statistical analysis conducted on geographies consisting of 60,871,919 people shows a weak negative correlation between the proportion of Tlingit-Haida and percentage of population with at least 10th grade education in the United States with a correlation coefficient (R) of -0.282 and weighted average of 95.7%, a difference of 1.1%.
10th Grade Correlation Summary
| Measurement | Immigrants from Germany | Tlingit-Haida |
| Minimum | 91.9% | 90.1% |
| Maximum | 100.0% | 100.0% |
| Range | 8.1% | 9.9% |
| Mean | 98.0% | 97.2% |
| Median | 98.1% | 97.7% |
| Interquartile 25% (IQ1) | 96.7% | 96.2% |
| Interquartile 75% (IQ3) | 100.0% | 98.8% |
| Interquartile Range (IQR) | 3.3% | 2.7% |
| Standard Deviation (Sample) | 2.1% | 2.1% |
| Standard Deviation (Population) | 2.1% | 2.1% |
Similar Demographics by 10th Grade
Demographics Similar to Immigrants from Germany by 10th Grade
In terms of 10th grade, the demographic groups most similar to Immigrants from Germany are Soviet Union (94.6%, a difference of 0.0%), Menominee (94.6%, a difference of 0.0%), Immigrants from Switzerland (94.6%, a difference of 0.0%), Yugoslavian (94.6%, a difference of 0.010%), and Lebanese (94.6%, a difference of 0.010%).
| Demographics | Rating | Rank | 10th Grade |
| Immigrants | Saudi Arabia | 99.0 /100 | #87 | Exceptional 94.7% |
| Immigrants | Japan | 99.0 /100 | #88 | Exceptional 94.7% |
| Immigrants | Moldova | 98.9 /100 | #89 | Exceptional 94.7% |
| South Africans | 98.8 /100 | #90 | Exceptional 94.7% |
| Whites/Caucasians | 98.8 /100 | #91 | Exceptional 94.7% |
| Yugoslavians | 98.4 /100 | #92 | Exceptional 94.6% |
| Soviet Union | 98.3 /100 | #93 | Exceptional 94.6% |
| Immigrants | Germany | 98.3 /100 | #94 | Exceptional 94.6% |
| Menominee | 98.3 /100 | #95 | Exceptional 94.6% |
| Immigrants | Switzerland | 98.3 /100 | #96 | Exceptional 94.6% |
| Lebanese | 98.3 /100 | #97 | Exceptional 94.6% |
| Immigrants | Bulgaria | 98.1 /100 | #98 | Exceptional 94.6% |
| Immigrants | France | 97.9 /100 | #99 | Exceptional 94.5% |
| Immigrants | South Central Asia | 97.8 /100 | #100 | Exceptional 94.5% |
| Syrians | 97.7 /100 | #101 | Exceptional 94.5% |
Demographics Similar to Tlingit-Haida by 10th Grade
In terms of 10th grade, the demographic groups most similar to Tlingit-Haida are Danish (95.7%, a difference of 0.040%), English (95.6%, a difference of 0.040%), Tsimshian (95.6%, a difference of 0.040%), Irish (95.6%, a difference of 0.060%), and Croatian (95.7%, a difference of 0.080%).
| Demographics | Rating | Rank | 10th Grade |
| Carpatho Rusyns | 100.0 /100 | #5 | Exceptional 95.9% |
| Poles | 100.0 /100 | #6 | Exceptional 95.8% |
| Germans | 100.0 /100 | #7 | Exceptional 95.8% |
| Lithuanians | 100.0 /100 | #8 | Exceptional 95.8% |
| Finns | 100.0 /100 | #9 | Exceptional 95.8% |
| Croatians | 100.0 /100 | #10 | Exceptional 95.7% |
| Danes | 100.0 /100 | #11 | Exceptional 95.7% |
| Tlingit-Haida | 100.0 /100 | #12 | Exceptional 95.7% |
| English | 100.0 /100 | #13 | Exceptional 95.6% |
| Tsimshian | 100.0 /100 | #14 | Exceptional 95.6% |
| Irish | 100.0 /100 | #15 | Exceptional 95.6% |
| Scottish | 100.0 /100 | #16 | Exceptional 95.6% |
| Latvians | 100.0 /100 | #17 | Exceptional 95.6% |
| Italians | 100.0 /100 | #18 | Exceptional 95.6% |
| Scandinavians | 100.0 /100 | #19 | Exceptional 95.6% |