Scottish vs Tohono O'odham 10th Grade
COMPARE
Scottish
Tohono O'odham
10th Grade
10th Grade Comparison
Scottish
Tohono O'odham
95.6%
10TH GRADE
100.0/ 100
METRIC RATING
16th/ 347
METRIC RANK
90.1%
10TH GRADE
0.0/ 100
METRIC RATING
322nd/ 347
METRIC RANK
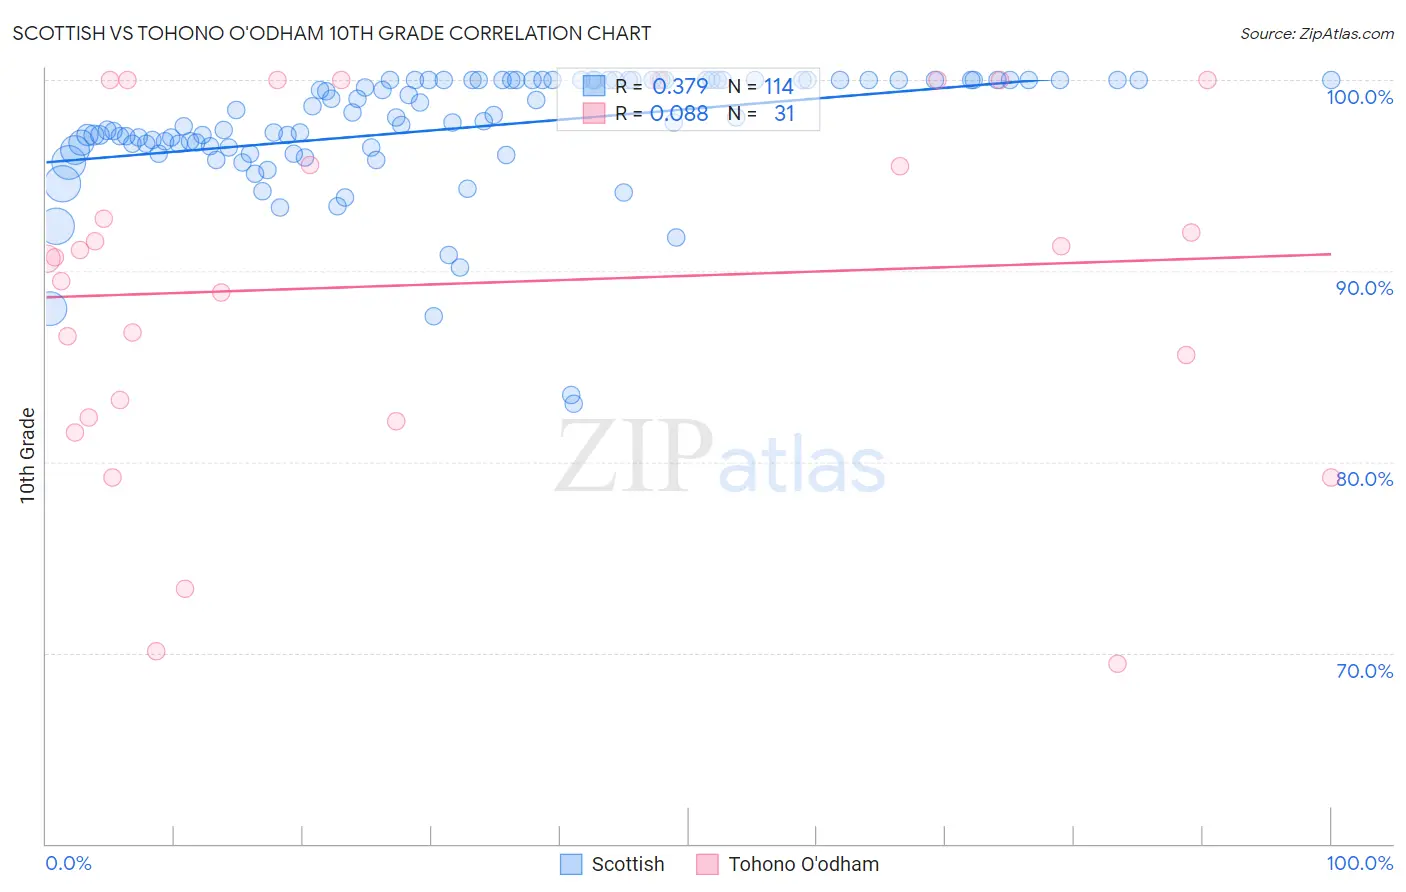
Scottish vs Tohono O'odham 10th Grade Correlation Chart
The statistical analysis conducted on geographies consisting of 567,140,525 people shows a mild positive correlation between the proportion of Scottish and percentage of population with at least 10th grade education in the United States with a correlation coefficient (R) of 0.379 and weighted average of 95.6%. Similarly, the statistical analysis conducted on geographies consisting of 58,730,615 people shows a slight positive correlation between the proportion of Tohono O'odham and percentage of population with at least 10th grade education in the United States with a correlation coefficient (R) of 0.088 and weighted average of 90.1%, a difference of 6.0%.
10th Grade Correlation Summary
| Measurement | Scottish | Tohono O'odham |
| Minimum | 83.1% | 69.4% |
| Maximum | 100.0% | 100.0% |
| Range | 16.9% | 30.6% |
| Mean | 97.5% | 89.3% |
| Median | 97.9% | 90.7% |
| Interquartile 25% (IQ1) | 96.5% | 82.3% |
| Interquartile 75% (IQ3) | 100.0% | 100.0% |
| Interquartile Range (IQR) | 3.5% | 17.7% |
| Standard Deviation (Sample) | 3.2% | 9.1% |
| Standard Deviation (Population) | 3.2% | 8.9% |
Similar Demographics by 10th Grade
Demographics Similar to Scottish by 10th Grade
In terms of 10th grade, the demographic groups most similar to Scottish are Irish (95.6%, a difference of 0.010%), Latvian (95.6%, a difference of 0.010%), Italian (95.6%, a difference of 0.020%), Scandinavian (95.6%, a difference of 0.020%), and Tsimshian (95.6%, a difference of 0.030%).
| Demographics | Rating | Rank | 10th Grade |
| Finns | 100.0 /100 | #9 | Exceptional 95.8% |
| Croatians | 100.0 /100 | #10 | Exceptional 95.7% |
| Danes | 100.0 /100 | #11 | Exceptional 95.7% |
| Tlingit-Haida | 100.0 /100 | #12 | Exceptional 95.7% |
| English | 100.0 /100 | #13 | Exceptional 95.6% |
| Tsimshian | 100.0 /100 | #14 | Exceptional 95.6% |
| Irish | 100.0 /100 | #15 | Exceptional 95.6% |
| Scottish | 100.0 /100 | #16 | Exceptional 95.6% |
| Latvians | 100.0 /100 | #17 | Exceptional 95.6% |
| Italians | 100.0 /100 | #18 | Exceptional 95.6% |
| Scandinavians | 100.0 /100 | #19 | Exceptional 95.6% |
| Chinese | 100.0 /100 | #20 | Exceptional 95.5% |
| Dutch | 100.0 /100 | #21 | Exceptional 95.5% |
| Eastern Europeans | 100.0 /100 | #22 | Exceptional 95.5% |
| Czechs | 100.0 /100 | #23 | Exceptional 95.5% |
Demographics Similar to Tohono O'odham by 10th Grade
In terms of 10th grade, the demographic groups most similar to Tohono O'odham are Houma (90.2%, a difference of 0.010%), Belizean (90.2%, a difference of 0.010%), Nicaraguan (90.2%, a difference of 0.020%), Immigrants from Belize (90.1%, a difference of 0.090%), and Immigrants from Cuba (90.2%, a difference of 0.10%).
| Demographics | Rating | Rank | 10th Grade |
| Immigrants | Caribbean | 0.0 /100 | #315 | Tragic 90.6% |
| Ecuadorians | 0.0 /100 | #316 | Tragic 90.6% |
| Immigrants | Ecuador | 0.0 /100 | #317 | Tragic 90.4% |
| Immigrants | Cuba | 0.0 /100 | #318 | Tragic 90.2% |
| Nicaraguans | 0.0 /100 | #319 | Tragic 90.2% |
| Houma | 0.0 /100 | #320 | Tragic 90.2% |
| Belizeans | 0.0 /100 | #321 | Tragic 90.2% |
| Tohono O'odham | 0.0 /100 | #322 | Tragic 90.1% |
| Immigrants | Belize | 0.0 /100 | #323 | Tragic 90.1% |
| Immigrants | Armenia | 0.0 /100 | #324 | Tragic 89.9% |
| Puerto Ricans | 0.0 /100 | #325 | Tragic 89.8% |
| Central American Indians | 0.0 /100 | #326 | Tragic 89.7% |
| Immigrants | Nicaragua | 0.0 /100 | #327 | Tragic 89.5% |
| Immigrants | Cabo Verde | 0.0 /100 | #328 | Tragic 89.5% |
| Dominicans | 0.0 /100 | #329 | Tragic 89.4% |