Immigrants from Brazil vs Tlingit-Haida 10th Grade
COMPARE
Immigrants from Brazil
Tlingit-Haida
10th Grade
10th Grade Comparison
Immigrants from Brazil
Tlingit-Haida
94.0%
10TH GRADE
75.5/ 100
METRIC RATING
153rd/ 347
METRIC RANK
95.7%
10TH GRADE
100.0/ 100
METRIC RATING
12th/ 347
METRIC RANK
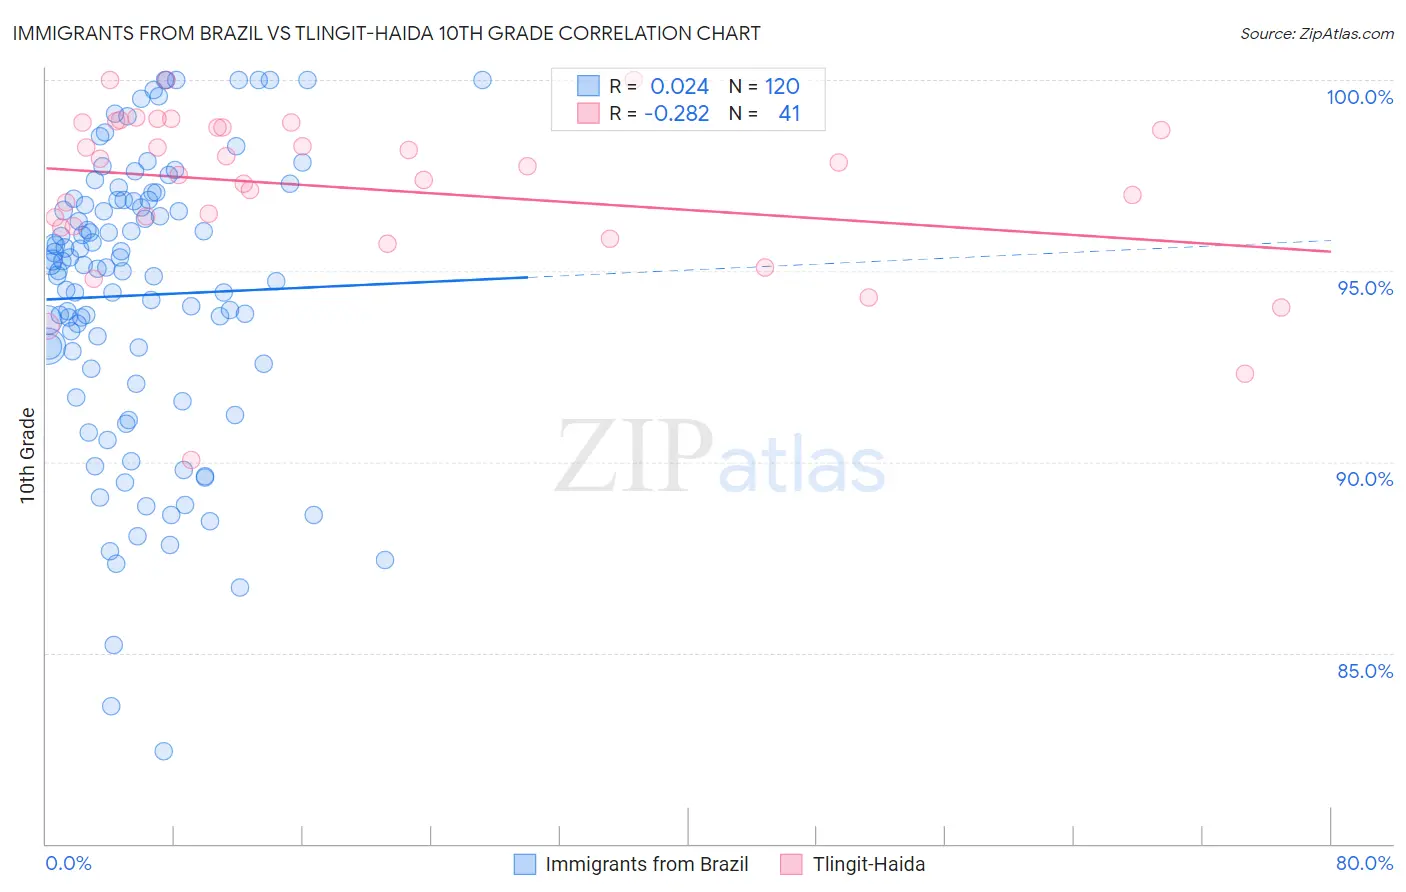
Immigrants from Brazil vs Tlingit-Haida 10th Grade Correlation Chart
The statistical analysis conducted on geographies consisting of 342,965,001 people shows no correlation between the proportion of Immigrants from Brazil and percentage of population with at least 10th grade education in the United States with a correlation coefficient (R) of 0.024 and weighted average of 94.0%. Similarly, the statistical analysis conducted on geographies consisting of 60,871,919 people shows a weak negative correlation between the proportion of Tlingit-Haida and percentage of population with at least 10th grade education in the United States with a correlation coefficient (R) of -0.282 and weighted average of 95.7%, a difference of 1.8%.
10th Grade Correlation Summary
| Measurement | Immigrants from Brazil | Tlingit-Haida |
| Minimum | 82.4% | 90.1% |
| Maximum | 100.0% | 100.0% |
| Range | 17.6% | 9.9% |
| Mean | 94.4% | 97.2% |
| Median | 95.1% | 97.7% |
| Interquartile 25% (IQ1) | 92.5% | 96.2% |
| Interquartile 75% (IQ3) | 96.8% | 98.8% |
| Interquartile Range (IQR) | 4.3% | 2.7% |
| Standard Deviation (Sample) | 3.8% | 2.1% |
| Standard Deviation (Population) | 3.8% | 2.1% |
Similar Demographics by 10th Grade
Demographics Similar to Immigrants from Brazil by 10th Grade
In terms of 10th grade, the demographic groups most similar to Immigrants from Brazil are Immigrants from Kenya (94.0%, a difference of 0.0%), Spanish (94.0%, a difference of 0.010%), Mongolian (94.0%, a difference of 0.010%), Immigrants from Italy (94.0%, a difference of 0.030%), and Kiowa (93.9%, a difference of 0.030%).
| Demographics | Rating | Rank | 10th Grade |
| Chickasaw | 82.6 /100 | #146 | Excellent 94.1% |
| Immigrants | Ukraine | 81.5 /100 | #147 | Excellent 94.0% |
| Arabs | 80.9 /100 | #148 | Excellent 94.0% |
| Ugandans | 80.7 /100 | #149 | Excellent 94.0% |
| Egyptians | 79.6 /100 | #150 | Good 94.0% |
| Kenyans | 79.1 /100 | #151 | Good 94.0% |
| Immigrants | Italy | 78.0 /100 | #152 | Good 94.0% |
| Immigrants | Brazil | 75.5 /100 | #153 | Good 94.0% |
| Immigrants | Kenya | 75.3 /100 | #154 | Good 94.0% |
| Spanish | 74.9 /100 | #155 | Good 94.0% |
| Mongolians | 74.4 /100 | #156 | Good 94.0% |
| Kiowa | 73.3 /100 | #157 | Good 93.9% |
| Bermudans | 71.0 /100 | #158 | Good 93.9% |
| Chileans | 70.2 /100 | #159 | Good 93.9% |
| Pakistanis | 70.1 /100 | #160 | Good 93.9% |
Demographics Similar to Tlingit-Haida by 10th Grade
In terms of 10th grade, the demographic groups most similar to Tlingit-Haida are Danish (95.7%, a difference of 0.040%), English (95.6%, a difference of 0.040%), Tsimshian (95.6%, a difference of 0.040%), Irish (95.6%, a difference of 0.060%), and Croatian (95.7%, a difference of 0.080%).
| Demographics | Rating | Rank | 10th Grade |
| Carpatho Rusyns | 100.0 /100 | #5 | Exceptional 95.9% |
| Poles | 100.0 /100 | #6 | Exceptional 95.8% |
| Germans | 100.0 /100 | #7 | Exceptional 95.8% |
| Lithuanians | 100.0 /100 | #8 | Exceptional 95.8% |
| Finns | 100.0 /100 | #9 | Exceptional 95.8% |
| Croatians | 100.0 /100 | #10 | Exceptional 95.7% |
| Danes | 100.0 /100 | #11 | Exceptional 95.7% |
| Tlingit-Haida | 100.0 /100 | #12 | Exceptional 95.7% |
| English | 100.0 /100 | #13 | Exceptional 95.6% |
| Tsimshian | 100.0 /100 | #14 | Exceptional 95.6% |
| Irish | 100.0 /100 | #15 | Exceptional 95.6% |
| Scottish | 100.0 /100 | #16 | Exceptional 95.6% |
| Latvians | 100.0 /100 | #17 | Exceptional 95.6% |
| Italians | 100.0 /100 | #18 | Exceptional 95.6% |
| Scandinavians | 100.0 /100 | #19 | Exceptional 95.6% |