Scottish vs Immigrants from Western Asia 4th Grade
COMPARE
Scottish
Immigrants from Western Asia
4th Grade
4th Grade Comparison
Scottish
Immigrants from Western Asia
98.4%
4TH GRADE
100.0/ 100
METRIC RATING
16th/ 347
METRIC RANK
97.2%
4TH GRADE
3.4/ 100
METRIC RATING
232nd/ 347
METRIC RANK
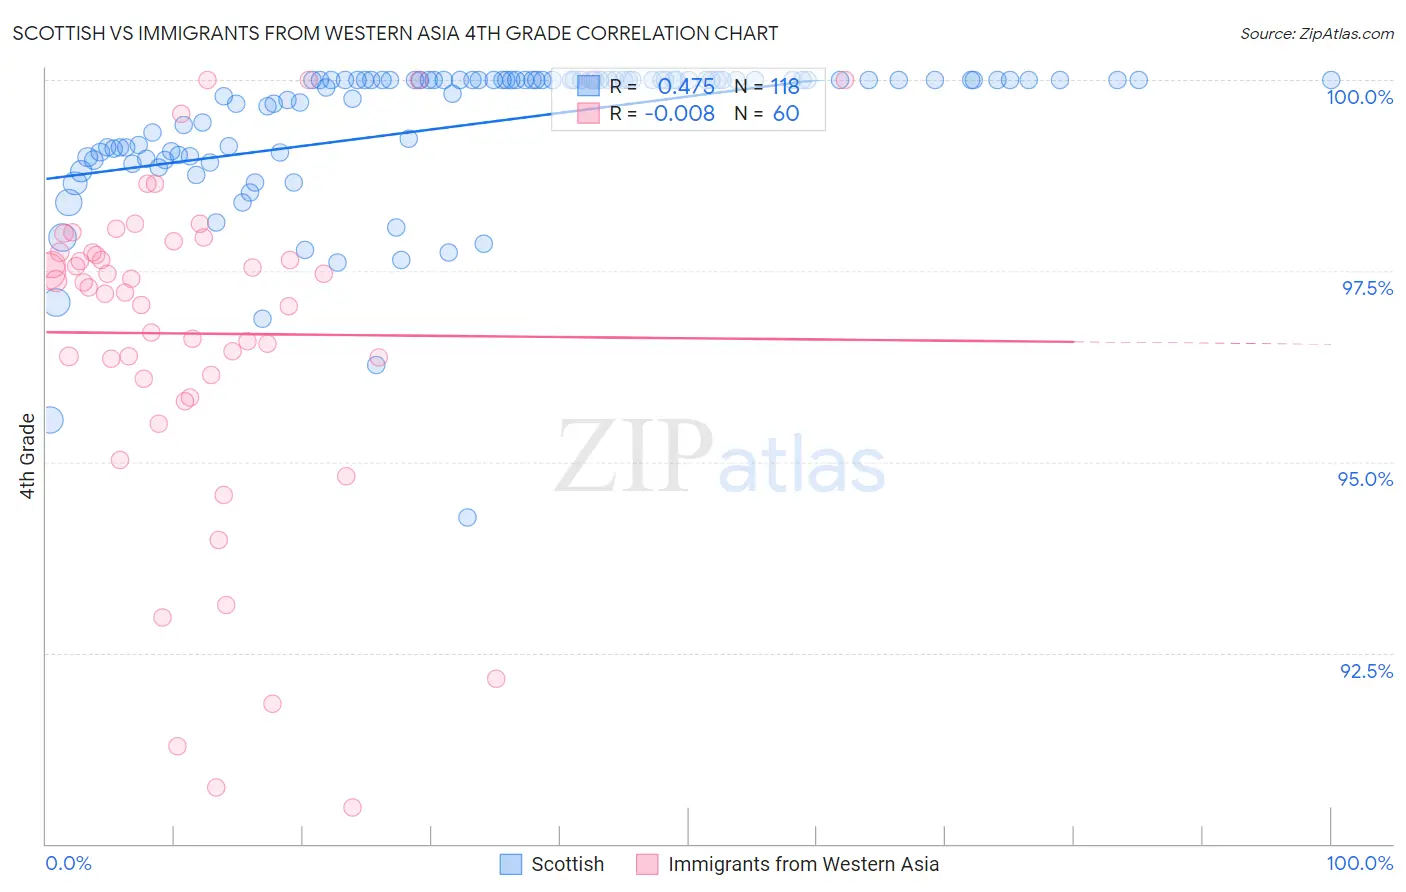
Scottish vs Immigrants from Western Asia 4th Grade Correlation Chart
The statistical analysis conducted on geographies consisting of 567,141,733 people shows a moderate positive correlation between the proportion of Scottish and percentage of population with at least 4th grade education in the United States with a correlation coefficient (R) of 0.475 and weighted average of 98.4%. Similarly, the statistical analysis conducted on geographies consisting of 404,424,892 people shows no correlation between the proportion of Immigrants from Western Asia and percentage of population with at least 4th grade education in the United States with a correlation coefficient (R) of -0.008 and weighted average of 97.2%, a difference of 1.2%.
4th Grade Correlation Summary
| Measurement | Scottish | Immigrants from Western Asia |
| Minimum | 94.3% | 90.5% |
| Maximum | 100.0% | 100.0% |
| Range | 5.7% | 9.5% |
| Mean | 99.4% | 96.7% |
| Median | 100.0% | 97.3% |
| Interquartile 25% (IQ1) | 99.0% | 96.1% |
| Interquartile 75% (IQ3) | 100.0% | 97.8% |
| Interquartile Range (IQR) | 0.98% | 1.7% |
| Standard Deviation (Sample) | 0.99% | 2.2% |
| Standard Deviation (Population) | 0.99% | 2.2% |
Similar Demographics by 4th Grade
Demographics Similar to Scottish by 4th Grade
In terms of 4th grade, the demographic groups most similar to Scottish are Dutch (98.4%, a difference of 0.0%), Pennsylvania German (98.4%, a difference of 0.0%), Polish (98.4%, a difference of 0.010%), Irish (98.4%, a difference of 0.010%), and Alaska Native (98.4%, a difference of 0.020%).
| Demographics | Rating | Rank | 4th Grade |
| Slovenes | 100.0 /100 | #9 | Exceptional 98.4% |
| Alaskan Athabascans | 100.0 /100 | #10 | Exceptional 98.4% |
| English | 100.0 /100 | #11 | Exceptional 98.4% |
| Tlingit-Haida | 100.0 /100 | #12 | Exceptional 98.4% |
| Swedes | 100.0 /100 | #13 | Exceptional 98.4% |
| Carpatho Rusyns | 100.0 /100 | #14 | Exceptional 98.4% |
| Dutch | 100.0 /100 | #15 | Exceptional 98.4% |
| Scottish | 100.0 /100 | #16 | Exceptional 98.4% |
| Pennsylvania Germans | 100.0 /100 | #17 | Exceptional 98.4% |
| Poles | 100.0 /100 | #18 | Exceptional 98.4% |
| Irish | 100.0 /100 | #19 | Exceptional 98.4% |
| Alaska Natives | 100.0 /100 | #20 | Exceptional 98.4% |
| Lithuanians | 100.0 /100 | #21 | Exceptional 98.3% |
| Finns | 100.0 /100 | #22 | Exceptional 98.3% |
| Sioux | 100.0 /100 | #23 | Exceptional 98.3% |
Demographics Similar to Immigrants from Western Asia by 4th Grade
In terms of 4th grade, the demographic groups most similar to Immigrants from Western Asia are Uruguayan (97.2%, a difference of 0.0%), Immigrants from Malaysia (97.2%, a difference of 0.0%), Bahamian (97.2%, a difference of 0.010%), Immigrants from Pakistan (97.2%, a difference of 0.010%), and Subsaharan African (97.2%, a difference of 0.010%).
| Demographics | Rating | Rank | 4th Grade |
| Immigrants | Iraq | 4.6 /100 | #225 | Tragic 97.2% |
| Bahamians | 3.8 /100 | #226 | Tragic 97.2% |
| Immigrants | Pakistan | 3.7 /100 | #227 | Tragic 97.2% |
| Sub-Saharan Africans | 3.6 /100 | #228 | Tragic 97.2% |
| Liberians | 3.6 /100 | #229 | Tragic 97.2% |
| Uruguayans | 3.5 /100 | #230 | Tragic 97.2% |
| Immigrants | Malaysia | 3.4 /100 | #231 | Tragic 97.2% |
| Immigrants | Western Asia | 3.4 /100 | #232 | Tragic 97.2% |
| Senegalese | 3.1 /100 | #233 | Tragic 97.2% |
| Assyrians/Chaldeans/Syriacs | 3.0 /100 | #234 | Tragic 97.2% |
| Yuman | 2.9 /100 | #235 | Tragic 97.2% |
| Immigrants | Eastern Asia | 2.7 /100 | #236 | Tragic 97.2% |
| Immigrants | Costa Rica | 2.0 /100 | #237 | Tragic 97.2% |
| Indians (Asian) | 1.9 /100 | #238 | Tragic 97.2% |
| Nigerians | 1.8 /100 | #239 | Tragic 97.1% |