Asian vs Immigrants from Western Asia College, Under 1 year
COMPARE
Asian
Immigrants from Western Asia
College, Under 1 year
College, Under 1 year Comparison
Asians
Immigrants from Western Asia
69.4%
COLLEGE, UNDER 1 YEAR
99.6/ 100
METRIC RATING
57th/ 347
METRIC RANK
67.8%
COLLEGE, UNDER 1 YEAR
96.6/ 100
METRIC RATING
104th/ 347
METRIC RANK
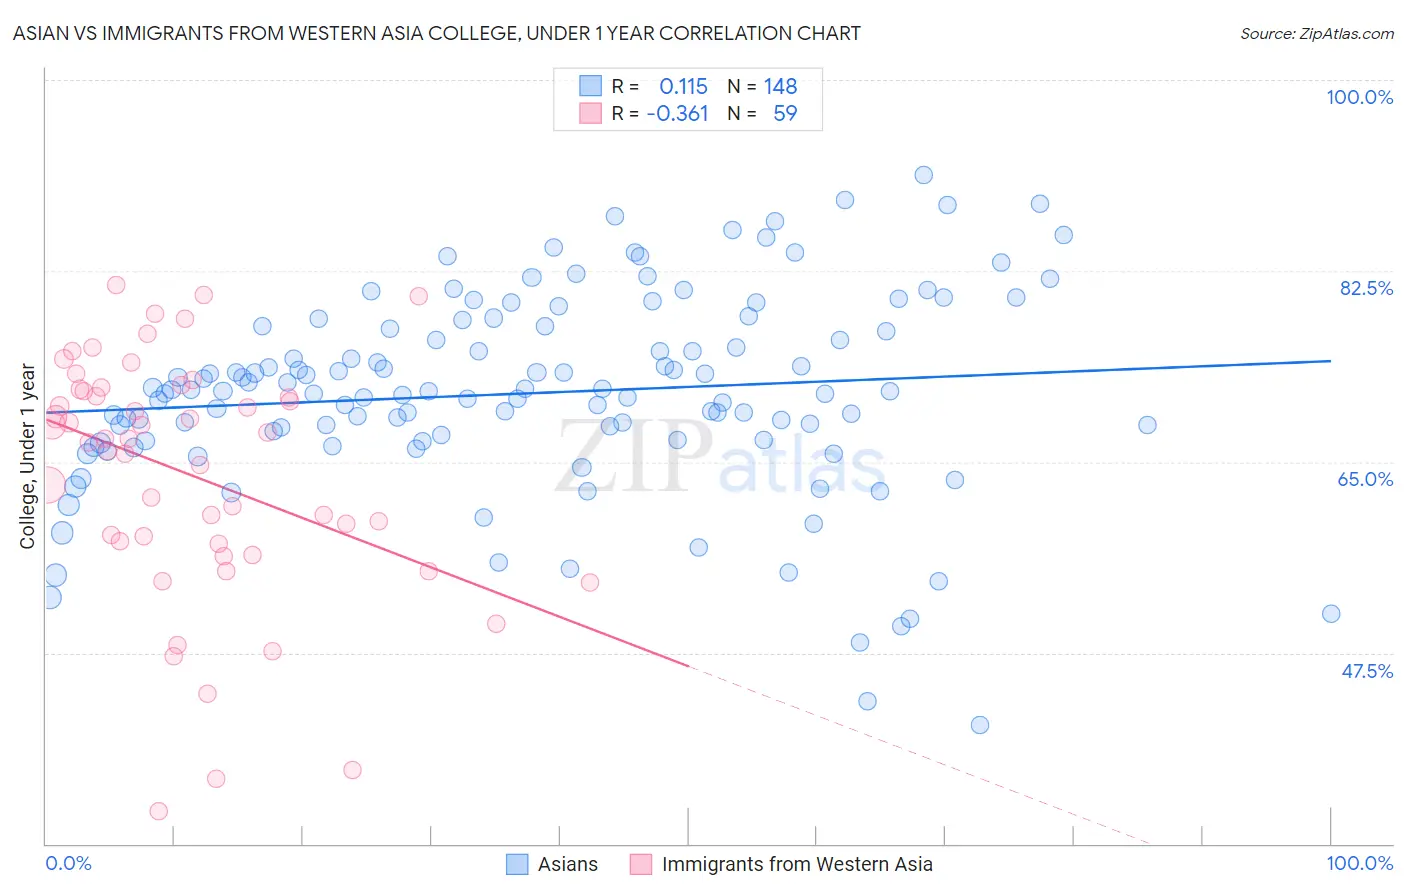
Asian vs Immigrants from Western Asia College, Under 1 year Correlation Chart
The statistical analysis conducted on geographies consisting of 550,912,370 people shows a poor positive correlation between the proportion of Asians and percentage of population with at least college, under 1 year education in the United States with a correlation coefficient (R) of 0.115 and weighted average of 69.4%. Similarly, the statistical analysis conducted on geographies consisting of 404,433,725 people shows a mild negative correlation between the proportion of Immigrants from Western Asia and percentage of population with at least college, under 1 year education in the United States with a correlation coefficient (R) of -0.361 and weighted average of 67.8%, a difference of 2.3%.
College, Under 1 year Correlation Summary
| Measurement | Asian | Immigrants from Western Asia |
| Minimum | 40.9% | 33.0% |
| Maximum | 91.3% | 81.2% |
| Range | 50.4% | 48.2% |
| Mean | 71.3% | 63.9% |
| Median | 71.5% | 67.1% |
| Interquartile 25% (IQ1) | 67.0% | 57.5% |
| Interquartile 75% (IQ3) | 77.3% | 71.6% |
| Interquartile Range (IQR) | 10.3% | 14.2% |
| Standard Deviation (Sample) | 9.2% | 11.2% |
| Standard Deviation (Population) | 9.1% | 11.1% |
Similar Demographics by College, Under 1 year
Demographics Similar to Asians by College, Under 1 year
In terms of college, under 1 year, the demographic groups most similar to Asians are Immigrants from Scotland (69.4%, a difference of 0.020%), Immigrants from Malaysia (69.3%, a difference of 0.10%), Maltese (69.5%, a difference of 0.14%), Immigrants from Serbia (69.3%, a difference of 0.23%), and Immigrants from Czechoslovakia (69.6%, a difference of 0.25%).
| Demographics | Rating | Rank | College, Under 1 year |
| Zimbabweans | 99.8 /100 | #50 | Exceptional 69.9% |
| Mongolians | 99.8 /100 | #51 | Exceptional 69.9% |
| Immigrants | Russia | 99.8 /100 | #52 | Exceptional 69.9% |
| South Africans | 99.7 /100 | #53 | Exceptional 69.7% |
| Immigrants | Czechoslovakia | 99.7 /100 | #54 | Exceptional 69.6% |
| Maltese | 99.7 /100 | #55 | Exceptional 69.5% |
| Immigrants | Scotland | 99.6 /100 | #56 | Exceptional 69.4% |
| Asians | 99.6 /100 | #57 | Exceptional 69.4% |
| Immigrants | Malaysia | 99.6 /100 | #58 | Exceptional 69.3% |
| Immigrants | Serbia | 99.5 /100 | #59 | Exceptional 69.3% |
| Immigrants | Asia | 99.5 /100 | #60 | Exceptional 69.2% |
| Immigrants | Kazakhstan | 99.5 /100 | #61 | Exceptional 69.2% |
| Immigrants | Belarus | 99.5 /100 | #62 | Exceptional 69.2% |
| Immigrants | Canada | 99.4 /100 | #63 | Exceptional 69.1% |
| Northern Europeans | 99.4 /100 | #64 | Exceptional 69.0% |
Demographics Similar to Immigrants from Western Asia by College, Under 1 year
In terms of college, under 1 year, the demographic groups most similar to Immigrants from Western Asia are Afghan (67.8%, a difference of 0.0%), Immigrants from Croatia (67.8%, a difference of 0.010%), Carpatho Rusyn (67.9%, a difference of 0.070%), Austrian (67.8%, a difference of 0.070%), and Immigrants from Eastern Europe (67.9%, a difference of 0.080%).
| Demographics | Rating | Rank | College, Under 1 year |
| Immigrants | Ethiopia | 97.3 /100 | #97 | Exceptional 68.0% |
| Paraguayans | 97.1 /100 | #98 | Exceptional 67.9% |
| Immigrants | Bolivia | 97.0 /100 | #99 | Exceptional 67.9% |
| Immigrants | Argentina | 97.0 /100 | #100 | Exceptional 67.9% |
| Immigrants | Eastern Europe | 96.9 /100 | #101 | Exceptional 67.9% |
| Palestinians | 96.9 /100 | #102 | Exceptional 67.9% |
| Carpatho Rusyns | 96.8 /100 | #103 | Exceptional 67.9% |
| Immigrants | Western Asia | 96.6 /100 | #104 | Exceptional 67.8% |
| Afghans | 96.6 /100 | #105 | Exceptional 67.8% |
| Immigrants | Croatia | 96.6 /100 | #106 | Exceptional 67.8% |
| Austrians | 96.4 /100 | #107 | Exceptional 67.8% |
| Immigrants | Egypt | 96.0 /100 | #108 | Exceptional 67.7% |
| Scandinavians | 95.8 /100 | #109 | Exceptional 67.7% |
| Assyrians/Chaldeans/Syriacs | 95.8 /100 | #110 | Exceptional 67.7% |
| Ukrainians | 95.8 /100 | #111 | Exceptional 67.7% |