Scottish vs French Professional Degree
COMPARE
Scottish
French
Professional Degree
Professional Degree Comparison
Scottish
French
4.6%
PROFESSIONAL DEGREE
71.8/ 100
METRIC RATING
154th/ 347
METRIC RANK
4.2%
PROFESSIONAL DEGREE
27.1/ 100
METRIC RATING
193rd/ 347
METRIC RANK
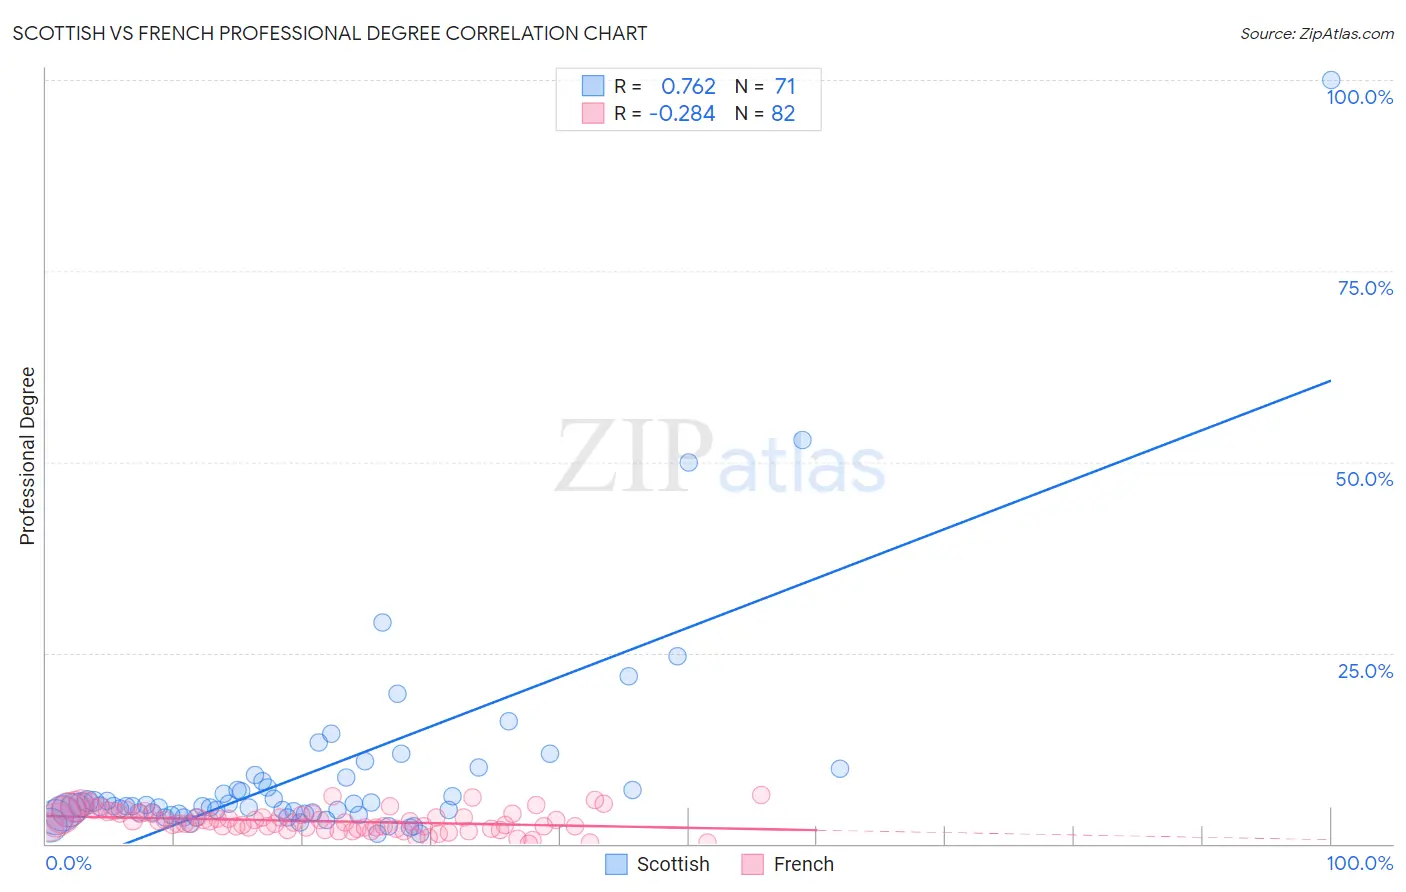
Scottish vs French Professional Degree Correlation Chart
The statistical analysis conducted on geographies consisting of 558,904,242 people shows a strong positive correlation between the proportion of Scottish and percentage of population with at least professional degree education in the United States with a correlation coefficient (R) of 0.762 and weighted average of 4.6%. Similarly, the statistical analysis conducted on geographies consisting of 564,087,067 people shows a weak negative correlation between the proportion of French and percentage of population with at least professional degree education in the United States with a correlation coefficient (R) of -0.284 and weighted average of 4.2%, a difference of 7.3%.
Professional Degree Correlation Summary
| Measurement | Scottish | French |
| Minimum | 1.3% | 0.047% |
| Maximum | 100.0% | 6.4% |
| Range | 98.7% | 6.4% |
| Mean | 9.2% | 3.0% |
| Median | 4.9% | 2.8% |
| Interquartile 25% (IQ1) | 4.0% | 2.1% |
| Interquartile 75% (IQ3) | 8.2% | 4.0% |
| Interquartile Range (IQR) | 4.2% | 1.9% |
| Standard Deviation (Sample) | 14.2% | 1.4% |
| Standard Deviation (Population) | 14.1% | 1.4% |
Similar Demographics by Professional Degree
Demographics Similar to Scottish by Professional Degree
In terms of professional degree, the demographic groups most similar to Scottish are Immigrants from Africa (4.6%, a difference of 0.12%), Immigrants from Uruguay (4.6%, a difference of 0.12%), Polish (4.6%, a difference of 0.14%), Slavic (4.5%, a difference of 0.18%), and Immigrants from Oceania (4.6%, a difference of 0.28%).
| Demographics | Rating | Rank | Professional Degree |
| Colombians | 77.7 /100 | #147 | Good 4.6% |
| Slovenes | 76.1 /100 | #148 | Good 4.6% |
| Senegalese | 75.3 /100 | #149 | Good 4.6% |
| Immigrants | Oceania | 73.4 /100 | #150 | Good 4.6% |
| Poles | 72.6 /100 | #151 | Good 4.6% |
| Immigrants | Africa | 72.5 /100 | #152 | Good 4.6% |
| Immigrants | Uruguay | 72.5 /100 | #153 | Good 4.6% |
| Scottish | 71.8 /100 | #154 | Good 4.6% |
| Slavs | 70.8 /100 | #155 | Good 4.5% |
| Swedes | 69.9 /100 | #156 | Good 4.5% |
| Iraqis | 69.8 /100 | #157 | Good 4.5% |
| Immigrants | Armenia | 68.8 /100 | #158 | Good 4.5% |
| Vietnamese | 68.4 /100 | #159 | Good 4.5% |
| Immigrants | Senegal | 68.0 /100 | #160 | Good 4.5% |
| Assyrians/Chaldeans/Syriacs | 67.4 /100 | #161 | Good 4.5% |
Demographics Similar to French by Professional Degree
In terms of professional degree, the demographic groups most similar to French are Ghanaian (4.3%, a difference of 0.040%), Scandinavian (4.2%, a difference of 0.25%), Sri Lankan (4.3%, a difference of 0.37%), Immigrants from Poland (4.3%, a difference of 0.40%), and Nigerian (4.2%, a difference of 0.49%).
| Demographics | Rating | Rank | Professional Degree |
| Scotch-Irish | 34.2 /100 | #186 | Fair 4.3% |
| Immigrants | Cameroon | 33.3 /100 | #187 | Fair 4.3% |
| Immigrants | Thailand | 31.7 /100 | #188 | Fair 4.3% |
| Slovaks | 30.7 /100 | #189 | Fair 4.3% |
| Immigrants | Poland | 29.2 /100 | #190 | Fair 4.3% |
| Sri Lankans | 29.0 /100 | #191 | Fair 4.3% |
| Ghanaians | 27.3 /100 | #192 | Fair 4.3% |
| French | 27.1 /100 | #193 | Fair 4.2% |
| Scandinavians | 25.8 /100 | #194 | Fair 4.2% |
| Nigerians | 24.6 /100 | #195 | Fair 4.2% |
| Spanish | 23.0 /100 | #196 | Fair 4.2% |
| Czechoslovakians | 22.4 /100 | #197 | Fair 4.2% |
| Immigrants | Middle Africa | 22.1 /100 | #198 | Fair 4.2% |
| Norwegians | 20.5 /100 | #199 | Fair 4.2% |
| Immigrants | North Macedonia | 20.2 /100 | #200 | Fair 4.2% |