Scottish vs Immigrants from Lithuania Receiving Food Stamps
COMPARE
Scottish
Immigrants from Lithuania
Receiving Food Stamps
Receiving Food Stamps Comparison
Scottish
Immigrants from Lithuania
9.9%
RECEIVING FOOD STAMPS
98.9/ 100
METRIC RATING
71st/ 347
METRIC RANK
9.2%
RECEIVING FOOD STAMPS
99.8/ 100
METRIC RATING
29th/ 347
METRIC RANK
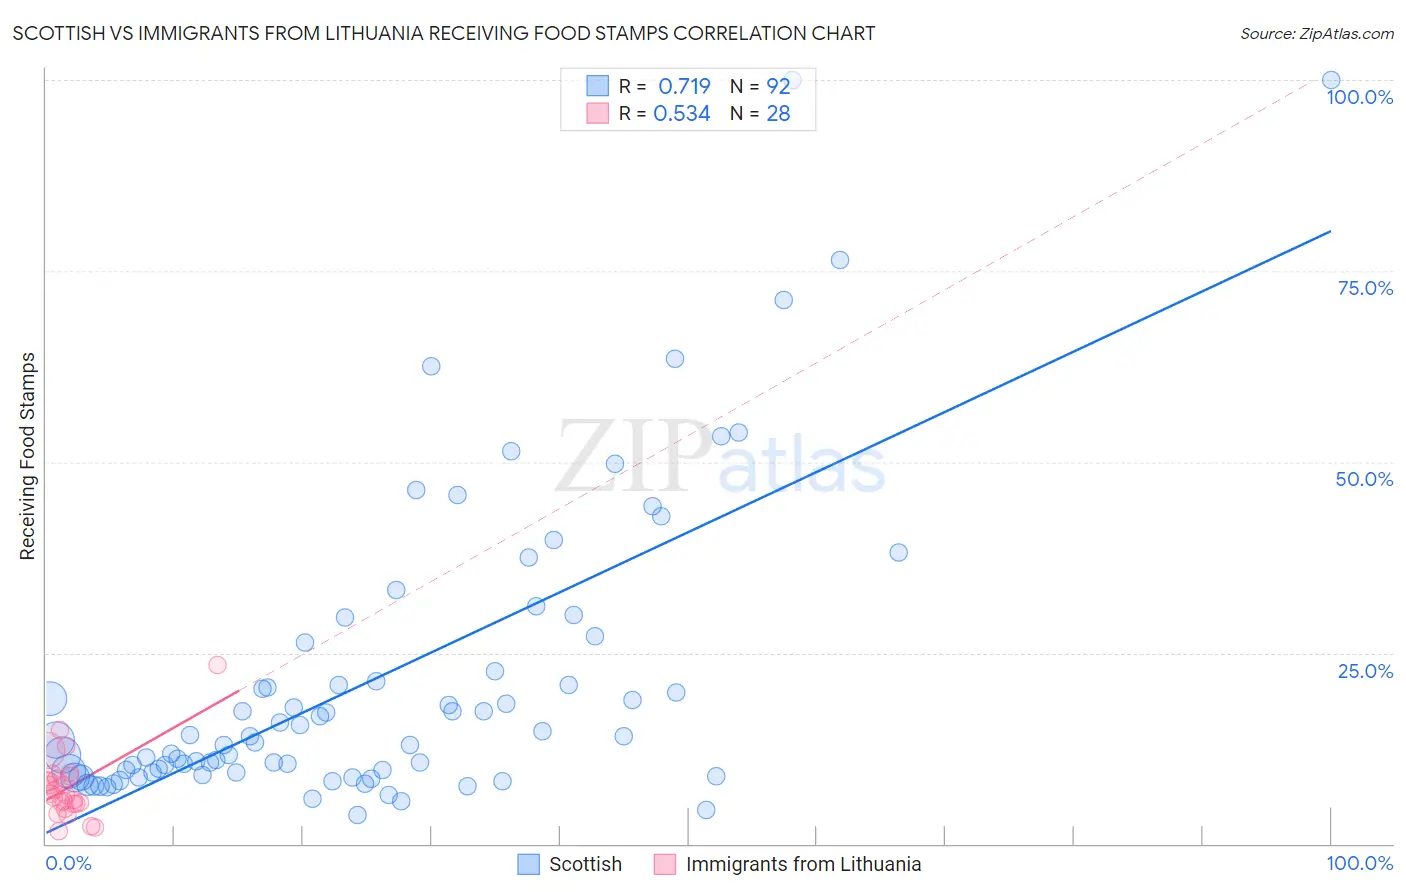
Scottish vs Immigrants from Lithuania Receiving Food Stamps Correlation Chart
The statistical analysis conducted on geographies consisting of 563,544,150 people shows a strong positive correlation between the proportion of Scottish and percentage of population receiving government assistance and/or food stamps in the United States with a correlation coefficient (R) of 0.719 and weighted average of 9.9%. Similarly, the statistical analysis conducted on geographies consisting of 117,609,856 people shows a substantial positive correlation between the proportion of Immigrants from Lithuania and percentage of population receiving government assistance and/or food stamps in the United States with a correlation coefficient (R) of 0.534 and weighted average of 9.2%, a difference of 6.8%.
Receiving Food Stamps Correlation Summary
| Measurement | Scottish | Immigrants from Lithuania |
| Minimum | 3.7% | 1.6% |
| Maximum | 100.0% | 23.4% |
| Range | 96.3% | 21.8% |
| Mean | 21.7% | 7.4% |
| Median | 13.8% | 6.4% |
| Interquartile 25% (IQ1) | 9.4% | 5.2% |
| Interquartile 75% (IQ3) | 24.5% | 8.6% |
| Interquartile Range (IQR) | 15.1% | 3.4% |
| Standard Deviation (Sample) | 19.9% | 4.4% |
| Standard Deviation (Population) | 19.8% | 4.3% |
Similar Demographics by Receiving Food Stamps
Demographics Similar to Scottish by Receiving Food Stamps
In terms of receiving food stamps, the demographic groups most similar to Scottish are Immigrants from Serbia (9.9%, a difference of 0.13%), Italian (9.9%, a difference of 0.18%), Immigrants from Asia (9.9%, a difference of 0.24%), Macedonian (9.9%, a difference of 0.30%), and Northern European (9.8%, a difference of 0.39%).
| Demographics | Rating | Rank | Receiving Food Stamps |
| Immigrants | North America | 99.2 /100 | #64 | Exceptional 9.8% |
| Immigrants | Turkey | 99.1 /100 | #65 | Exceptional 9.8% |
| Slovenes | 99.1 /100 | #66 | Exceptional 9.8% |
| Immigrants | Indonesia | 99.0 /100 | #67 | Exceptional 9.8% |
| Northern Europeans | 99.0 /100 | #68 | Exceptional 9.8% |
| Italians | 99.0 /100 | #69 | Exceptional 9.9% |
| Immigrants | Serbia | 99.0 /100 | #70 | Exceptional 9.9% |
| Scottish | 98.9 /100 | #71 | Exceptional 9.9% |
| Immigrants | Asia | 98.9 /100 | #72 | Exceptional 9.9% |
| Macedonians | 98.9 /100 | #73 | Exceptional 9.9% |
| New Zealanders | 98.8 /100 | #74 | Exceptional 9.9% |
| Immigrants | Zimbabwe | 98.7 /100 | #75 | Exceptional 9.9% |
| Immigrants | Croatia | 98.7 /100 | #76 | Exceptional 10.0% |
| Immigrants | North Macedonia | 98.7 /100 | #77 | Exceptional 10.0% |
| South Africans | 98.7 /100 | #78 | Exceptional 10.0% |
Demographics Similar to Immigrants from Lithuania by Receiving Food Stamps
In terms of receiving food stamps, the demographic groups most similar to Immigrants from Lithuania are Czech (9.2%, a difference of 0.27%), Bhutanese (9.2%, a difference of 0.28%), Immigrants from Sweden (9.3%, a difference of 0.37%), Swedish (9.2%, a difference of 0.52%), and Immigrants from Ireland (9.2%, a difference of 0.72%).
| Demographics | Rating | Rank | Receiving Food Stamps |
| Immigrants | Australia | 99.8 /100 | #22 | Exceptional 9.2% |
| Eastern Europeans | 99.8 /100 | #23 | Exceptional 9.2% |
| Immigrants | Northern Europe | 99.8 /100 | #24 | Exceptional 9.2% |
| Immigrants | Ireland | 99.8 /100 | #25 | Exceptional 9.2% |
| Swedes | 99.8 /100 | #26 | Exceptional 9.2% |
| Bhutanese | 99.8 /100 | #27 | Exceptional 9.2% |
| Czechs | 99.8 /100 | #28 | Exceptional 9.2% |
| Immigrants | Lithuania | 99.8 /100 | #29 | Exceptional 9.2% |
| Immigrants | Sweden | 99.7 /100 | #30 | Exceptional 9.3% |
| Immigrants | Eastern Asia | 99.7 /100 | #31 | Exceptional 9.3% |
| Bolivians | 99.7 /100 | #32 | Exceptional 9.3% |
| Zimbabweans | 99.6 /100 | #33 | Exceptional 9.5% |
| Turks | 99.6 /100 | #34 | Exceptional 9.5% |
| Immigrants | Austria | 99.6 /100 | #35 | Exceptional 9.5% |
| Estonians | 99.6 /100 | #36 | Exceptional 9.5% |