Scottish vs Liberian Professional Degree
COMPARE
Scottish
Liberian
Professional Degree
Professional Degree Comparison
Scottish
Liberians
4.6%
PROFESSIONAL DEGREE
71.8/ 100
METRIC RATING
154th/ 347
METRIC RANK
3.6%
PROFESSIONAL DEGREE
0.5/ 100
METRIC RATING
276th/ 347
METRIC RANK
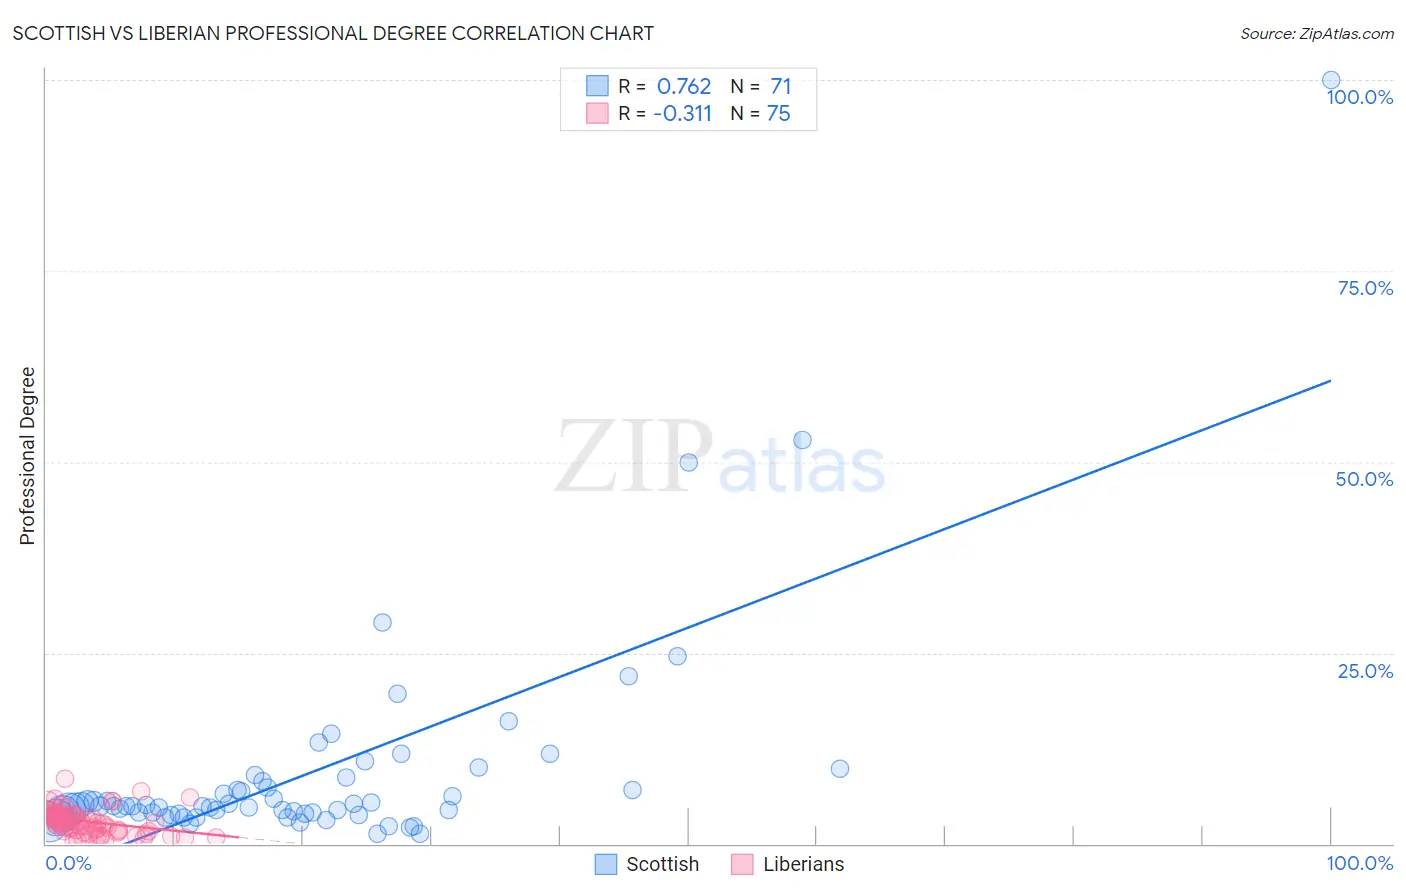
Scottish vs Liberian Professional Degree Correlation Chart
The statistical analysis conducted on geographies consisting of 558,904,242 people shows a strong positive correlation between the proportion of Scottish and percentage of population with at least professional degree education in the United States with a correlation coefficient (R) of 0.762 and weighted average of 4.6%. Similarly, the statistical analysis conducted on geographies consisting of 117,941,180 people shows a mild negative correlation between the proportion of Liberians and percentage of population with at least professional degree education in the United States with a correlation coefficient (R) of -0.311 and weighted average of 3.6%, a difference of 28.3%.
Professional Degree Correlation Summary
| Measurement | Scottish | Liberian |
| Minimum | 1.3% | 0.33% |
| Maximum | 100.0% | 8.5% |
| Range | 98.7% | 8.2% |
| Mean | 9.2% | 2.9% |
| Median | 4.9% | 2.8% |
| Interquartile 25% (IQ1) | 4.0% | 1.7% |
| Interquartile 75% (IQ3) | 8.2% | 3.8% |
| Interquartile Range (IQR) | 4.2% | 2.1% |
| Standard Deviation (Sample) | 14.2% | 1.6% |
| Standard Deviation (Population) | 14.1% | 1.6% |
Similar Demographics by Professional Degree
Demographics Similar to Scottish by Professional Degree
In terms of professional degree, the demographic groups most similar to Scottish are Immigrants from Africa (4.6%, a difference of 0.12%), Immigrants from Uruguay (4.6%, a difference of 0.12%), Polish (4.6%, a difference of 0.14%), Slavic (4.5%, a difference of 0.18%), and Immigrants from Oceania (4.6%, a difference of 0.28%).
| Demographics | Rating | Rank | Professional Degree |
| Colombians | 77.7 /100 | #147 | Good 4.6% |
| Slovenes | 76.1 /100 | #148 | Good 4.6% |
| Senegalese | 75.3 /100 | #149 | Good 4.6% |
| Immigrants | Oceania | 73.4 /100 | #150 | Good 4.6% |
| Poles | 72.6 /100 | #151 | Good 4.6% |
| Immigrants | Africa | 72.5 /100 | #152 | Good 4.6% |
| Immigrants | Uruguay | 72.5 /100 | #153 | Good 4.6% |
| Scottish | 71.8 /100 | #154 | Good 4.6% |
| Slavs | 70.8 /100 | #155 | Good 4.5% |
| Swedes | 69.9 /100 | #156 | Good 4.5% |
| Iraqis | 69.8 /100 | #157 | Good 4.5% |
| Immigrants | Armenia | 68.8 /100 | #158 | Good 4.5% |
| Vietnamese | 68.4 /100 | #159 | Good 4.5% |
| Immigrants | Senegal | 68.0 /100 | #160 | Good 4.5% |
| Assyrians/Chaldeans/Syriacs | 67.4 /100 | #161 | Good 4.5% |
Demographics Similar to Liberians by Professional Degree
In terms of professional degree, the demographic groups most similar to Liberians are Cheyenne (3.6%, a difference of 0.010%), Immigrants from Dominica (3.6%, a difference of 0.050%), Japanese (3.5%, a difference of 0.070%), Immigrants from Portugal (3.5%, a difference of 0.11%), and Dominican (3.5%, a difference of 0.15%).
| Demographics | Rating | Rank | Professional Degree |
| Immigrants | Cuba | 0.6 /100 | #269 | Tragic 3.6% |
| Central Americans | 0.6 /100 | #270 | Tragic 3.6% |
| Belizeans | 0.5 /100 | #271 | Tragic 3.6% |
| Immigrants | Jamaica | 0.5 /100 | #272 | Tragic 3.6% |
| Americans | 0.5 /100 | #273 | Tragic 3.6% |
| Potawatomi | 0.5 /100 | #274 | Tragic 3.6% |
| Immigrants | Dominica | 0.5 /100 | #275 | Tragic 3.6% |
| Liberians | 0.5 /100 | #276 | Tragic 3.6% |
| Cheyenne | 0.5 /100 | #277 | Tragic 3.6% |
| Japanese | 0.5 /100 | #278 | Tragic 3.5% |
| Immigrants | Portugal | 0.5 /100 | #279 | Tragic 3.5% |
| Dominicans | 0.5 /100 | #280 | Tragic 3.5% |
| Apache | 0.5 /100 | #281 | Tragic 3.5% |
| Immigrants | Caribbean | 0.5 /100 | #282 | Tragic 3.5% |
| Comanche | 0.4 /100 | #283 | Tragic 3.5% |