Macedonian vs Immigrants from Liberia Doctorate Degree
COMPARE
Macedonian
Immigrants from Liberia
Doctorate Degree
Doctorate Degree Comparison
Macedonians
Immigrants from Liberia
1.9%
DOCTORATE DEGREE
60.9/ 100
METRIC RATING
167th/ 347
METRIC RANK
1.5%
DOCTORATE DEGREE
0.5/ 100
METRIC RATING
266th/ 347
METRIC RANK
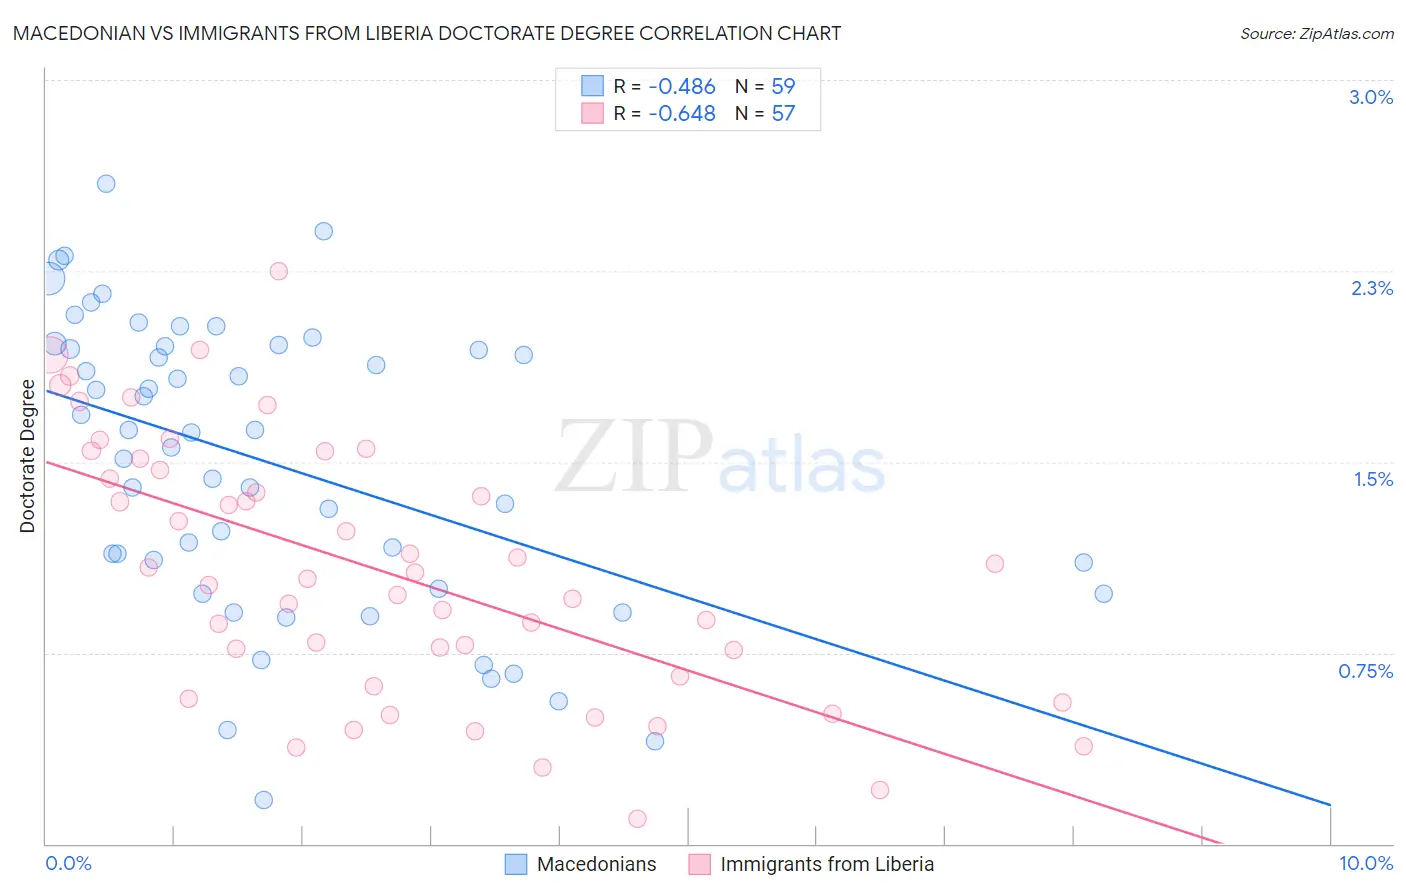
Macedonian vs Immigrants from Liberia Doctorate Degree Correlation Chart
The statistical analysis conducted on geographies consisting of 132,009,126 people shows a moderate negative correlation between the proportion of Macedonians and percentage of population with at least doctorate degree education in the United States with a correlation coefficient (R) of -0.486 and weighted average of 1.9%. Similarly, the statistical analysis conducted on geographies consisting of 134,868,003 people shows a significant negative correlation between the proportion of Immigrants from Liberia and percentage of population with at least doctorate degree education in the United States with a correlation coefficient (R) of -0.648 and weighted average of 1.5%, a difference of 25.6%.
Doctorate Degree Correlation Summary
| Measurement | Macedonian | Immigrants from Liberia |
| Minimum | 0.17% | 0.100% |
| Maximum | 2.6% | 2.2% |
| Range | 2.4% | 2.1% |
| Mean | 1.5% | 1.1% |
| Median | 1.6% | 1.0% |
| Interquartile 25% (IQ1) | 1.0% | 0.64% |
| Interquartile 75% (IQ3) | 2.0% | 1.5% |
| Interquartile Range (IQR) | 0.95% | 0.85% |
| Standard Deviation (Sample) | 0.57% | 0.51% |
| Standard Deviation (Population) | 0.57% | 0.50% |
Similar Demographics by Doctorate Degree
Demographics Similar to Macedonians by Doctorate Degree
In terms of doctorate degree, the demographic groups most similar to Macedonians are Sri Lankan (1.9%, a difference of 0.10%), Spaniard (1.9%, a difference of 0.39%), Scotch-Irish (1.9%, a difference of 0.41%), Celtic (1.9%, a difference of 0.90%), and Vietnamese (1.9%, a difference of 0.92%).
| Demographics | Rating | Rank | Doctorate Degree |
| Welsh | 69.7 /100 | #160 | Good 1.9% |
| Immigrants | Middle Africa | 68.8 /100 | #161 | Good 1.9% |
| Irish | 67.5 /100 | #162 | Good 1.9% |
| Czechs | 67.3 /100 | #163 | Good 1.9% |
| Celtics | 66.7 /100 | #164 | Good 1.9% |
| Scotch-Irish | 63.6 /100 | #165 | Good 1.9% |
| Spaniards | 63.5 /100 | #166 | Good 1.9% |
| Macedonians | 60.9 /100 | #167 | Good 1.9% |
| Sri Lankans | 60.3 /100 | #168 | Good 1.9% |
| Vietnamese | 54.8 /100 | #169 | Average 1.9% |
| Costa Ricans | 53.3 /100 | #170 | Average 1.8% |
| Bermudans | 52.1 /100 | #171 | Average 1.8% |
| Belgians | 50.3 /100 | #172 | Average 1.8% |
| Norwegians | 50.0 /100 | #173 | Average 1.8% |
| Immigrants | Bangladesh | 50.0 /100 | #174 | Average 1.8% |
Demographics Similar to Immigrants from Liberia by Doctorate Degree
In terms of doctorate degree, the demographic groups most similar to Immigrants from Liberia are Kiowa (1.5%, a difference of 0.65%), U.S. Virgin Islander (1.5%, a difference of 0.65%), Crow (1.5%, a difference of 0.74%), Salvadoran (1.5%, a difference of 0.77%), and Nicaraguan (1.5%, a difference of 0.78%).
| Demographics | Rating | Rank | Doctorate Degree |
| Liberians | 0.9 /100 | #259 | Tragic 1.5% |
| Japanese | 0.9 /100 | #260 | Tragic 1.5% |
| Immigrants | Portugal | 0.8 /100 | #261 | Tragic 1.5% |
| Chickasaw | 0.7 /100 | #262 | Tragic 1.5% |
| Immigrants | Bahamas | 0.7 /100 | #263 | Tragic 1.5% |
| Blackfeet | 0.7 /100 | #264 | Tragic 1.5% |
| Nicaraguans | 0.6 /100 | #265 | Tragic 1.5% |
| Immigrants | Liberia | 0.5 /100 | #266 | Tragic 1.5% |
| Kiowa | 0.5 /100 | #267 | Tragic 1.5% |
| U.S. Virgin Islanders | 0.5 /100 | #268 | Tragic 1.5% |
| Crow | 0.5 /100 | #269 | Tragic 1.5% |
| Salvadorans | 0.5 /100 | #270 | Tragic 1.5% |
| Immigrants | Trinidad and Tobago | 0.5 /100 | #271 | Tragic 1.5% |
| Immigrants | Barbados | 0.4 /100 | #272 | Tragic 1.5% |
| Sioux | 0.4 /100 | #273 | Tragic 1.5% |