Australian vs Immigrants from Liberia Doctorate Degree
COMPARE
Australian
Immigrants from Liberia
Doctorate Degree
Doctorate Degree Comparison
Australians
Immigrants from Liberia
2.4%
DOCTORATE DEGREE
100.0/ 100
METRIC RATING
51st/ 347
METRIC RANK
1.5%
DOCTORATE DEGREE
0.5/ 100
METRIC RATING
266th/ 347
METRIC RANK
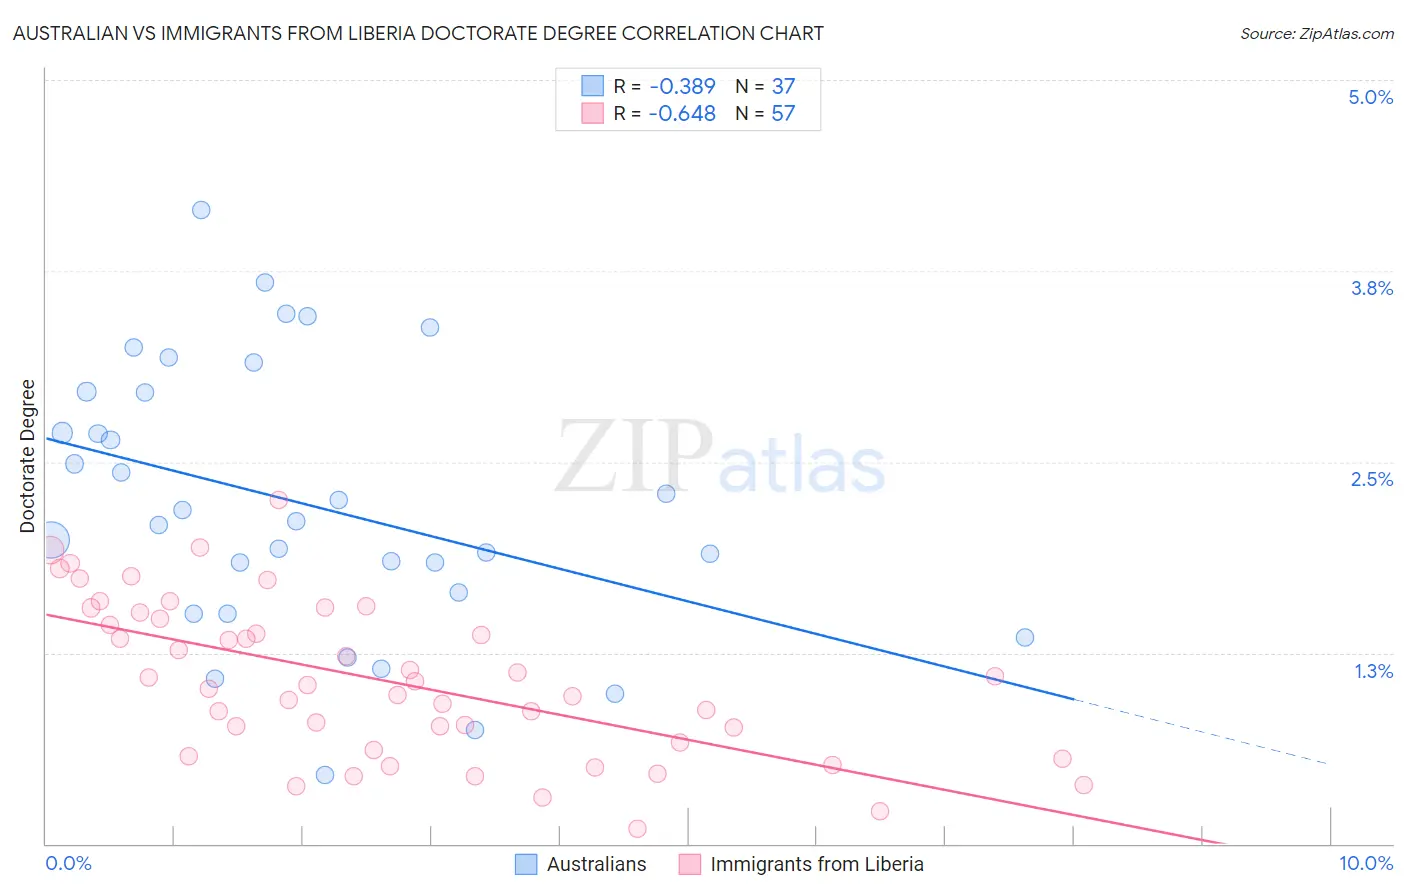
Australian vs Immigrants from Liberia Doctorate Degree Correlation Chart
The statistical analysis conducted on geographies consisting of 223,128,872 people shows a mild negative correlation between the proportion of Australians and percentage of population with at least doctorate degree education in the United States with a correlation coefficient (R) of -0.389 and weighted average of 2.4%. Similarly, the statistical analysis conducted on geographies consisting of 134,868,003 people shows a significant negative correlation between the proportion of Immigrants from Liberia and percentage of population with at least doctorate degree education in the United States with a correlation coefficient (R) of -0.648 and weighted average of 1.5%, a difference of 61.1%.
Doctorate Degree Correlation Summary
| Measurement | Australian | Immigrants from Liberia |
| Minimum | 0.45% | 0.100% |
| Maximum | 4.2% | 2.2% |
| Range | 3.7% | 2.1% |
| Mean | 2.2% | 1.1% |
| Median | 2.1% | 1.0% |
| Interquartile 25% (IQ1) | 1.6% | 0.64% |
| Interquartile 75% (IQ3) | 3.0% | 1.5% |
| Interquartile Range (IQR) | 1.4% | 0.85% |
| Standard Deviation (Sample) | 0.88% | 0.51% |
| Standard Deviation (Population) | 0.87% | 0.50% |
Similar Demographics by Doctorate Degree
Demographics Similar to Australians by Doctorate Degree
In terms of doctorate degree, the demographic groups most similar to Australians are Immigrants from Norway (2.4%, a difference of 0.090%), Bulgarian (2.4%, a difference of 0.47%), Immigrants from Latvia (2.4%, a difference of 0.59%), Immigrants from Asia (2.4%, a difference of 1.2%), and Immigrants from Indonesia (2.4%, a difference of 1.3%).
| Demographics | Rating | Rank | Doctorate Degree |
| Immigrants | Netherlands | 100.0 /100 | #44 | Exceptional 2.5% |
| Immigrants | South Africa | 100.0 /100 | #45 | Exceptional 2.4% |
| Immigrants | Austria | 100.0 /100 | #46 | Exceptional 2.4% |
| Immigrants | Western Europe | 100.0 /100 | #47 | Exceptional 2.4% |
| Asians | 100.0 /100 | #48 | Exceptional 2.4% |
| Immigrants | Asia | 100.0 /100 | #49 | Exceptional 2.4% |
| Immigrants | Norway | 100.0 /100 | #50 | Exceptional 2.4% |
| Australians | 100.0 /100 | #51 | Exceptional 2.4% |
| Bulgarians | 100.0 /100 | #52 | Exceptional 2.4% |
| Immigrants | Latvia | 100.0 /100 | #53 | Exceptional 2.4% |
| Immigrants | Indonesia | 100.0 /100 | #54 | Exceptional 2.4% |
| Bolivians | 100.0 /100 | #55 | Exceptional 2.4% |
| Immigrants | Czechoslovakia | 100.0 /100 | #56 | Exceptional 2.4% |
| Immigrants | Ethiopia | 100.0 /100 | #57 | Exceptional 2.4% |
| Ethiopians | 99.9 /100 | #58 | Exceptional 2.3% |
Demographics Similar to Immigrants from Liberia by Doctorate Degree
In terms of doctorate degree, the demographic groups most similar to Immigrants from Liberia are Kiowa (1.5%, a difference of 0.65%), U.S. Virgin Islander (1.5%, a difference of 0.65%), Crow (1.5%, a difference of 0.74%), Salvadoran (1.5%, a difference of 0.77%), and Nicaraguan (1.5%, a difference of 0.78%).
| Demographics | Rating | Rank | Doctorate Degree |
| Liberians | 0.9 /100 | #259 | Tragic 1.5% |
| Japanese | 0.9 /100 | #260 | Tragic 1.5% |
| Immigrants | Portugal | 0.8 /100 | #261 | Tragic 1.5% |
| Chickasaw | 0.7 /100 | #262 | Tragic 1.5% |
| Immigrants | Bahamas | 0.7 /100 | #263 | Tragic 1.5% |
| Blackfeet | 0.7 /100 | #264 | Tragic 1.5% |
| Nicaraguans | 0.6 /100 | #265 | Tragic 1.5% |
| Immigrants | Liberia | 0.5 /100 | #266 | Tragic 1.5% |
| Kiowa | 0.5 /100 | #267 | Tragic 1.5% |
| U.S. Virgin Islanders | 0.5 /100 | #268 | Tragic 1.5% |
| Crow | 0.5 /100 | #269 | Tragic 1.5% |
| Salvadorans | 0.5 /100 | #270 | Tragic 1.5% |
| Immigrants | Trinidad and Tobago | 0.5 /100 | #271 | Tragic 1.5% |
| Immigrants | Barbados | 0.4 /100 | #272 | Tragic 1.5% |
| Sioux | 0.4 /100 | #273 | Tragic 1.5% |