Scottish vs Slovak Doctorate Degree
COMPARE
Scottish
Slovak
Doctorate Degree
Doctorate Degree Comparison
Scottish
Slovaks
2.0%
DOCTORATE DEGREE
89.4/ 100
METRIC RATING
132nd/ 347
METRIC RANK
1.8%
DOCTORATE DEGREE
36.4/ 100
METRIC RATING
185th/ 347
METRIC RANK
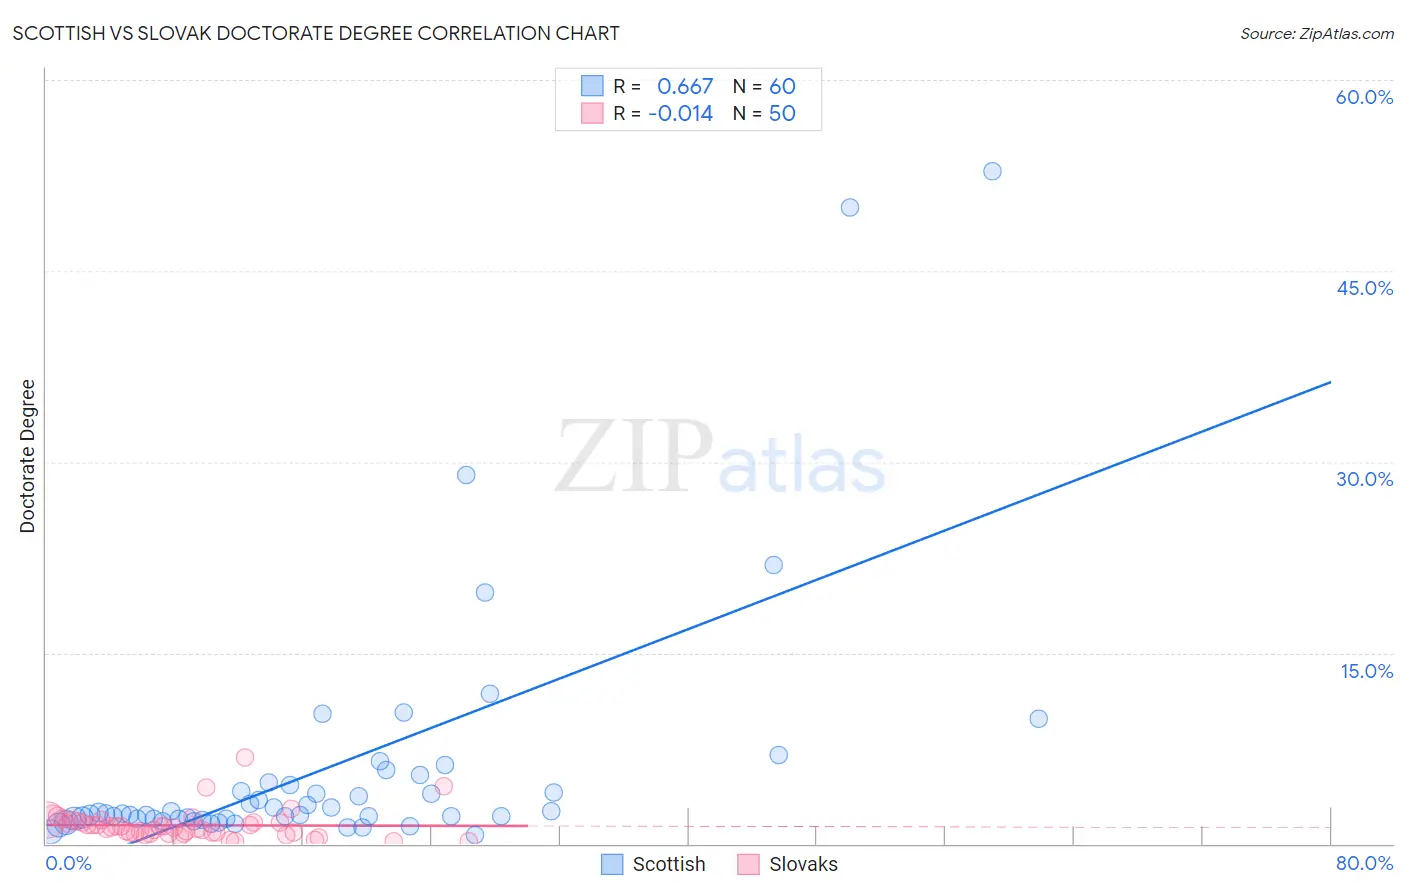
Scottish vs Slovak Doctorate Degree Correlation Chart
The statistical analysis conducted on geographies consisting of 542,697,657 people shows a significant positive correlation between the proportion of Scottish and percentage of population with at least doctorate degree education in the United States with a correlation coefficient (R) of 0.667 and weighted average of 2.0%. Similarly, the statistical analysis conducted on geographies consisting of 392,855,228 people shows no correlation between the proportion of Slovaks and percentage of population with at least doctorate degree education in the United States with a correlation coefficient (R) of -0.014 and weighted average of 1.8%, a difference of 10.1%.
Doctorate Degree Correlation Summary
| Measurement | Scottish | Slovak |
| Minimum | 0.73% | 0.17% |
| Maximum | 52.8% | 6.8% |
| Range | 52.1% | 6.6% |
| Mean | 5.9% | 1.5% |
| Median | 2.4% | 1.3% |
| Interquartile 25% (IQ1) | 2.0% | 0.83% |
| Interquartile 75% (IQ3) | 4.7% | 1.7% |
| Interquartile Range (IQR) | 2.7% | 0.88% |
| Standard Deviation (Sample) | 9.9% | 1.2% |
| Standard Deviation (Population) | 9.9% | 1.1% |
Similar Demographics by Doctorate Degree
Demographics Similar to Scottish by Doctorate Degree
In terms of doctorate degree, the demographic groups most similar to Scottish are Immigrants from Uzbekistan (2.0%, a difference of 0.050%), Immigrants from Cameroon (2.0%, a difference of 0.20%), Serbian (2.0%, a difference of 0.26%), Immigrants from Sierra Leone (2.0%, a difference of 0.28%), and Immigrants from Ukraine (2.0%, a difference of 0.41%).
| Demographics | Rating | Rank | Doctorate Degree |
| Moroccans | 93.0 /100 | #125 | Exceptional 2.0% |
| Jordanians | 92.1 /100 | #126 | Exceptional 2.0% |
| Palestinians | 92.0 /100 | #127 | Exceptional 2.0% |
| Immigrants | Zaire | 91.1 /100 | #128 | Exceptional 2.0% |
| Canadians | 90.6 /100 | #129 | Exceptional 2.0% |
| Immigrants | Ukraine | 90.5 /100 | #130 | Exceptional 2.0% |
| Immigrants | Sierra Leone | 90.2 /100 | #131 | Exceptional 2.0% |
| Scottish | 89.4 /100 | #132 | Excellent 2.0% |
| Immigrants | Uzbekistan | 89.3 /100 | #133 | Excellent 2.0% |
| Immigrants | Cameroon | 88.9 /100 | #134 | Excellent 2.0% |
| Serbians | 88.7 /100 | #135 | Excellent 2.0% |
| Swedes | 88.3 /100 | #136 | Excellent 2.0% |
| South American Indians | 88.3 /100 | #137 | Excellent 2.0% |
| Swiss | 88.0 /100 | #138 | Excellent 2.0% |
| Afghans | 87.2 /100 | #139 | Excellent 2.0% |
Demographics Similar to Slovaks by Doctorate Degree
In terms of doctorate degree, the demographic groups most similar to Slovaks are Peruvian (1.8%, a difference of 0.32%), Czechoslovakian (1.8%, a difference of 0.55%), Nigerian (1.8%, a difference of 0.57%), Finnish (1.8%, a difference of 0.90%), and German (1.8%, a difference of 1.0%).
| Demographics | Rating | Rank | Doctorate Degree |
| French | 48.8 /100 | #178 | Average 1.8% |
| Ghanaians | 48.3 /100 | #179 | Average 1.8% |
| Scandinavians | 48.0 /100 | #180 | Average 1.8% |
| Immigrants | Immigrants | 46.2 /100 | #181 | Average 1.8% |
| Immigrants | Afghanistan | 44.3 /100 | #182 | Average 1.8% |
| Finns | 42.1 /100 | #183 | Average 1.8% |
| Nigerians | 39.9 /100 | #184 | Fair 1.8% |
| Slovaks | 36.4 /100 | #185 | Fair 1.8% |
| Peruvians | 34.4 /100 | #186 | Fair 1.8% |
| Czechoslovakians | 33.0 /100 | #187 | Fair 1.8% |
| Germans | 30.5 /100 | #188 | Fair 1.8% |
| French Canadians | 30.2 /100 | #189 | Fair 1.8% |
| Immigrants | Costa Rica | 30.2 /100 | #190 | Fair 1.8% |
| South Americans | 29.5 /100 | #191 | Fair 1.8% |
| Dutch | 27.4 /100 | #192 | Fair 1.8% |