Mexican American Indian vs Sudanese Professional Degree
COMPARE
Mexican American Indian
Sudanese
Professional Degree
Professional Degree Comparison
Mexican American Indians
Sudanese
3.3%
PROFESSIONAL DEGREE
0.1/ 100
METRIC RATING
314th/ 347
METRIC RANK
4.6%
PROFESSIONAL DEGREE
81.3/ 100
METRIC RATING
142nd/ 347
METRIC RANK
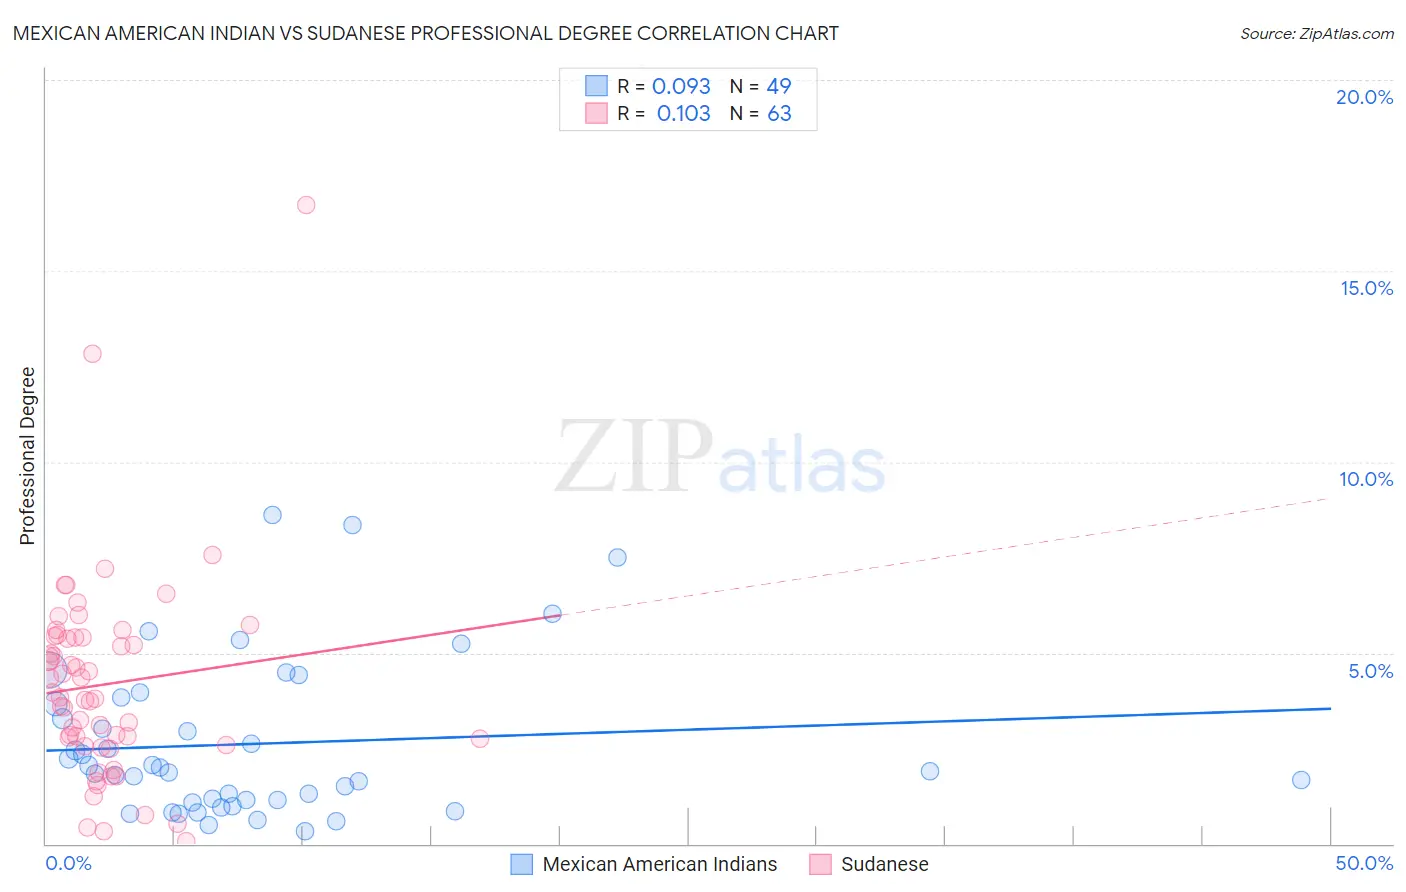
Mexican American Indian vs Sudanese Professional Degree Correlation Chart
The statistical analysis conducted on geographies consisting of 316,680,392 people shows a slight positive correlation between the proportion of Mexican American Indians and percentage of population with at least professional degree education in the United States with a correlation coefficient (R) of 0.093 and weighted average of 3.3%. Similarly, the statistical analysis conducted on geographies consisting of 110,066,536 people shows a poor positive correlation between the proportion of Sudanese and percentage of population with at least professional degree education in the United States with a correlation coefficient (R) of 0.103 and weighted average of 4.6%, a difference of 42.1%.
Professional Degree Correlation Summary
| Measurement | Mexican American Indian | Sudanese |
| Minimum | 0.34% | 0.061% |
| Maximum | 8.6% | 16.7% |
| Range | 8.3% | 16.7% |
| Mean | 2.6% | 4.2% |
| Median | 1.9% | 3.8% |
| Interquartile 25% (IQ1) | 1.1% | 2.6% |
| Interquartile 75% (IQ3) | 3.7% | 5.4% |
| Interquartile Range (IQR) | 2.6% | 2.8% |
| Standard Deviation (Sample) | 2.0% | 2.7% |
| Standard Deviation (Population) | 2.0% | 2.7% |
Similar Demographics by Professional Degree
Demographics Similar to Mexican American Indians by Professional Degree
In terms of professional degree, the demographic groups most similar to Mexican American Indians are Yuman (3.3%, a difference of 0.21%), Sioux (3.3%, a difference of 0.23%), Immigrants from Laos (3.2%, a difference of 0.68%), Puerto Rican (3.2%, a difference of 0.69%), and Cherokee (3.3%, a difference of 0.82%).
| Demographics | Rating | Rank | Professional Degree |
| Samoans | 0.1 /100 | #307 | Tragic 3.3% |
| Shoshone | 0.1 /100 | #308 | Tragic 3.3% |
| Pima | 0.1 /100 | #309 | Tragic 3.3% |
| Immigrants | Latin America | 0.1 /100 | #310 | Tragic 3.3% |
| Cherokee | 0.1 /100 | #311 | Tragic 3.3% |
| Sioux | 0.1 /100 | #312 | Tragic 3.3% |
| Yuman | 0.1 /100 | #313 | Tragic 3.3% |
| Mexican American Indians | 0.1 /100 | #314 | Tragic 3.3% |
| Immigrants | Laos | 0.1 /100 | #315 | Tragic 3.2% |
| Puerto Ricans | 0.1 /100 | #316 | Tragic 3.2% |
| Nepalese | 0.1 /100 | #317 | Tragic 3.2% |
| Immigrants | Micronesia | 0.1 /100 | #318 | Tragic 3.2% |
| Choctaw | 0.1 /100 | #319 | Tragic 3.2% |
| Seminole | 0.1 /100 | #320 | Tragic 3.2% |
| Tsimshian | 0.0 /100 | #321 | Tragic 3.2% |
Demographics Similar to Sudanese by Professional Degree
In terms of professional degree, the demographic groups most similar to Sudanese are Hungarian (4.6%, a difference of 0.11%), Basque (4.6%, a difference of 0.13%), Immigrants from South America (4.6%, a difference of 0.18%), Uruguayan (4.6%, a difference of 0.24%), and Luxembourger (4.6%, a difference of 0.55%).
| Demographics | Rating | Rank | Professional Degree |
| Macedonians | 89.8 /100 | #135 | Excellent 4.8% |
| Immigrants | Jordan | 89.0 /100 | #136 | Excellent 4.7% |
| Jordanians | 88.9 /100 | #137 | Excellent 4.7% |
| Afghans | 88.8 /100 | #138 | Excellent 4.7% |
| South Americans | 85.6 /100 | #139 | Excellent 4.7% |
| Canadians | 84.4 /100 | #140 | Excellent 4.7% |
| Basques | 81.8 /100 | #141 | Excellent 4.6% |
| Sudanese | 81.3 /100 | #142 | Excellent 4.6% |
| Hungarians | 80.8 /100 | #143 | Excellent 4.6% |
| Immigrants | South America | 80.5 /100 | #144 | Excellent 4.6% |
| Uruguayans | 80.2 /100 | #145 | Excellent 4.6% |
| Luxembourgers | 78.7 /100 | #146 | Good 4.6% |
| Colombians | 77.7 /100 | #147 | Good 4.6% |
| Slovenes | 76.1 /100 | #148 | Good 4.6% |
| Senegalese | 75.3 /100 | #149 | Good 4.6% |