Immigrants from Poland vs Scottish No Schooling Completed
COMPARE
Immigrants from Poland
Scottish
No Schooling Completed
No Schooling Completed Comparison
Immigrants from Poland
Scottish
2.1%
NO SCHOOLING COMPLETED
55.2/ 100
METRIC RATING
171st/ 347
METRIC RANK
1.4%
NO SCHOOLING COMPLETED
100.0/ 100
METRIC RATING
9th/ 347
METRIC RANK
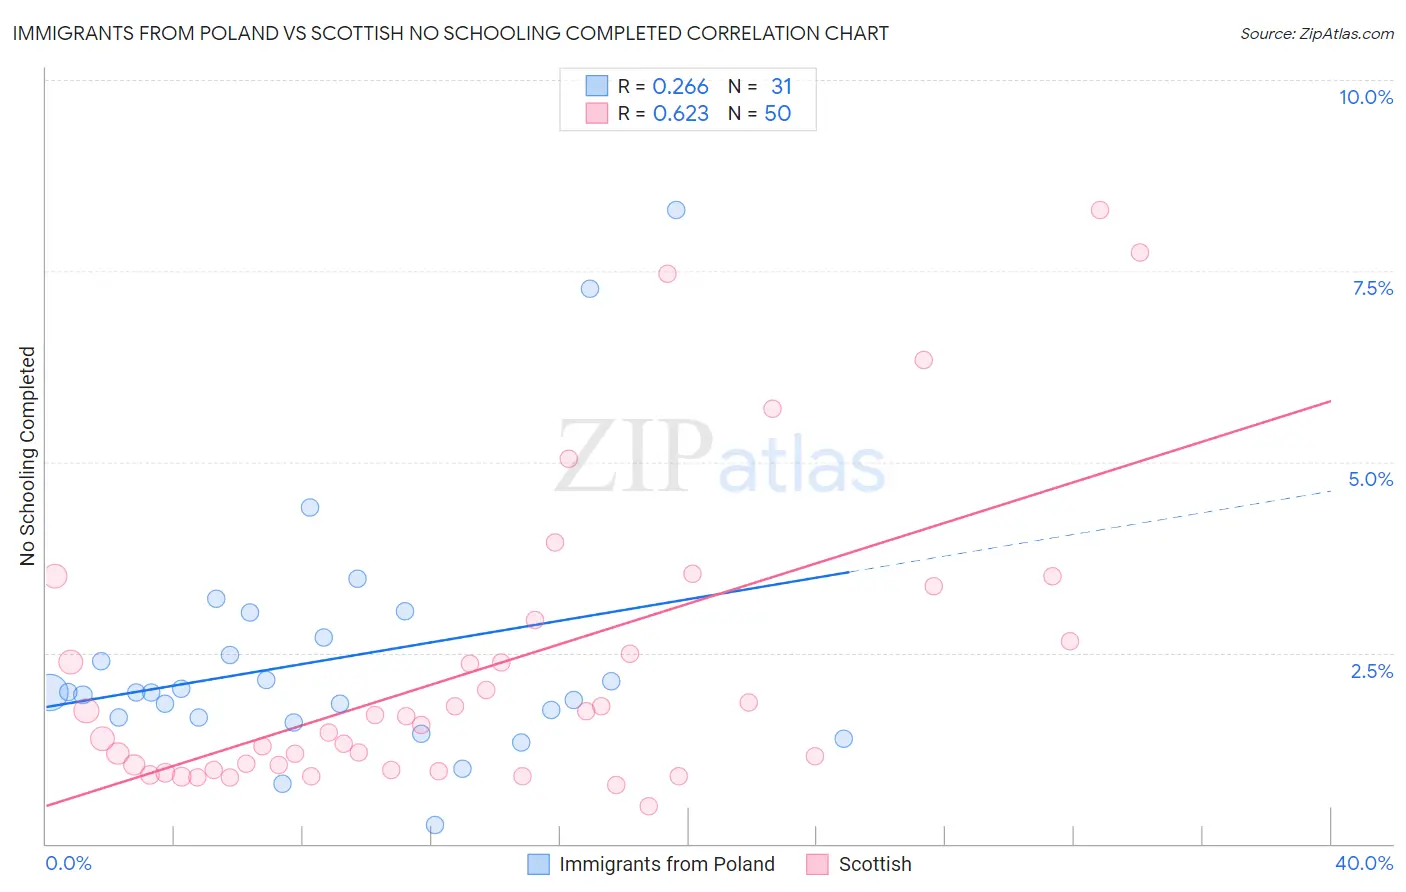
Immigrants from Poland vs Scottish No Schooling Completed Correlation Chart
The statistical analysis conducted on geographies consisting of 302,129,066 people shows a weak positive correlation between the proportion of Immigrants from Poland and percentage of population with no schooling in the United States with a correlation coefficient (R) of 0.266 and weighted average of 2.1%. Similarly, the statistical analysis conducted on geographies consisting of 548,415,962 people shows a significant positive correlation between the proportion of Scottish and percentage of population with no schooling in the United States with a correlation coefficient (R) of 0.623 and weighted average of 1.4%, a difference of 46.9%.
No Schooling Completed Correlation Summary
| Measurement | Immigrants from Poland | Scottish |
| Minimum | 0.25% | 0.50% |
| Maximum | 8.3% | 8.3% |
| Range | 8.0% | 7.8% |
| Mean | 2.4% | 2.3% |
| Median | 2.0% | 1.6% |
| Interquartile 25% (IQ1) | 1.6% | 0.97% |
| Interquartile 75% (IQ3) | 2.7% | 2.7% |
| Interquartile Range (IQR) | 1.0% | 1.7% |
| Standard Deviation (Sample) | 1.7% | 1.9% |
| Standard Deviation (Population) | 1.6% | 1.9% |
Similar Demographics by No Schooling Completed
Demographics Similar to Immigrants from Poland by No Schooling Completed
In terms of no schooling completed, the demographic groups most similar to Immigrants from Poland are Argentinean (2.1%, a difference of 0.11%), Apache (2.1%, a difference of 0.20%), Immigrants from Argentina (2.1%, a difference of 0.33%), Immigrants from Belarus (2.1%, a difference of 0.46%), and Cheyenne (2.1%, a difference of 0.47%).
| Demographics | Rating | Rank | No Schooling Completed |
| Comanche | 60.7 /100 | #164 | Good 2.1% |
| Brazilians | 60.2 /100 | #165 | Good 2.1% |
| Dutch West Indians | 59.9 /100 | #166 | Average 2.1% |
| Egyptians | 59.2 /100 | #167 | Average 2.1% |
| Cheyenne | 58.6 /100 | #168 | Average 2.1% |
| Apache | 56.7 /100 | #169 | Average 2.1% |
| Argentineans | 56.0 /100 | #170 | Average 2.1% |
| Immigrants | Poland | 55.2 /100 | #171 | Average 2.1% |
| Immigrants | Argentina | 52.7 /100 | #172 | Average 2.1% |
| Immigrants | Belarus | 51.8 /100 | #173 | Average 2.1% |
| Immigrants | Micronesia | 50.0 /100 | #174 | Average 2.1% |
| Arabs | 46.4 /100 | #175 | Average 2.1% |
| Panamanians | 45.2 /100 | #176 | Average 2.1% |
| Arapaho | 45.0 /100 | #177 | Average 2.1% |
| Pakistanis | 44.7 /100 | #178 | Average 2.1% |
Demographics Similar to Scottish by No Schooling Completed
In terms of no schooling completed, the demographic groups most similar to Scottish are Swedish (1.4%, a difference of 0.53%), Dutch (1.4%, a difference of 0.80%), Lithuanian (1.4%, a difference of 1.6%), Irish (1.4%, a difference of 1.7%), and Polish (1.4%, a difference of 1.7%).
| Demographics | Rating | Rank | No Schooling Completed |
| Slovaks | 100.0 /100 | #2 | Exceptional 1.3% |
| Norwegians | 100.0 /100 | #3 | Exceptional 1.3% |
| Germans | 100.0 /100 | #4 | Exceptional 1.4% |
| Slovenes | 100.0 /100 | #5 | Exceptional 1.4% |
| Carpatho Rusyns | 100.0 /100 | #6 | Exceptional 1.4% |
| English | 100.0 /100 | #7 | Exceptional 1.4% |
| Swedes | 100.0 /100 | #8 | Exceptional 1.4% |
| Scottish | 100.0 /100 | #9 | Exceptional 1.4% |
| Dutch | 100.0 /100 | #10 | Exceptional 1.4% |
| Lithuanians | 100.0 /100 | #11 | Exceptional 1.4% |
| Irish | 100.0 /100 | #12 | Exceptional 1.4% |
| Poles | 100.0 /100 | #13 | Exceptional 1.4% |
| Scotch-Irish | 100.0 /100 | #14 | Exceptional 1.5% |
| Tlingit-Haida | 100.0 /100 | #15 | Exceptional 1.5% |
| Finns | 100.0 /100 | #16 | Exceptional 1.5% |