Armenian vs Inupiat 11th Grade
COMPARE
Armenian
Inupiat
11th Grade
11th Grade Comparison
Armenians
Inupiat
91.7%
11TH GRADE
2.9/ 100
METRIC RATING
234th/ 347
METRIC RANK
92.4%
11TH GRADE
40.7/ 100
METRIC RATING
180th/ 347
METRIC RANK
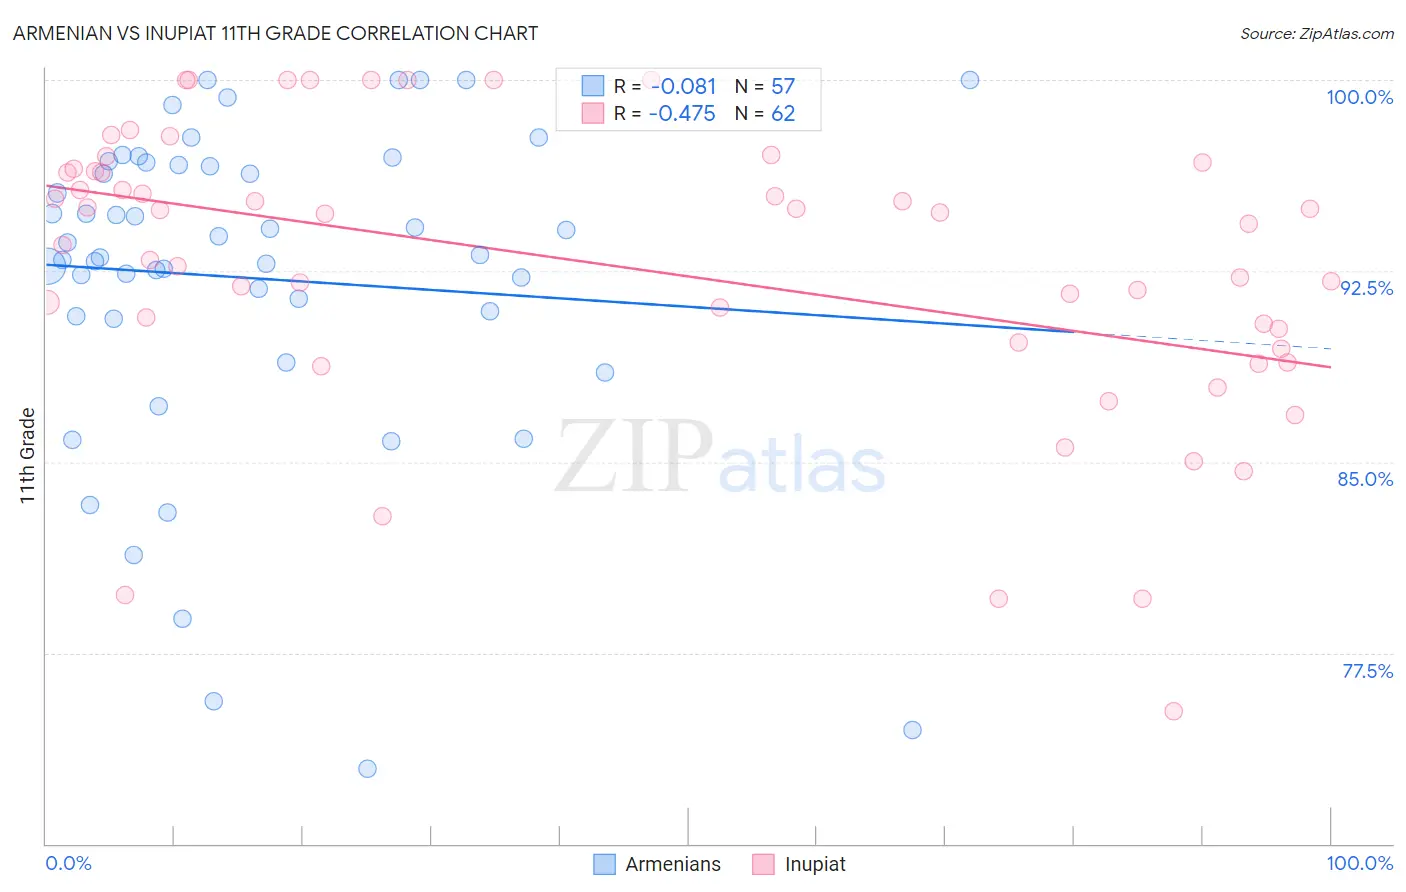
Armenian vs Inupiat 11th Grade Correlation Chart
The statistical analysis conducted on geographies consisting of 310,954,801 people shows a slight negative correlation between the proportion of Armenians and percentage of population with at least 11th grade education in the United States with a correlation coefficient (R) of -0.081 and weighted average of 91.7%. Similarly, the statistical analysis conducted on geographies consisting of 96,349,180 people shows a moderate negative correlation between the proportion of Inupiat and percentage of population with at least 11th grade education in the United States with a correlation coefficient (R) of -0.475 and weighted average of 92.4%, a difference of 0.78%.
11th Grade Correlation Summary
| Measurement | Armenian | Inupiat |
| Minimum | 73.0% | 75.2% |
| Maximum | 100.0% | 100.0% |
| Range | 27.0% | 24.8% |
| Mean | 92.2% | 92.7% |
| Median | 93.1% | 94.5% |
| Interquartile 25% (IQ1) | 90.7% | 89.7% |
| Interquartile 75% (IQ3) | 96.7% | 96.4% |
| Interquartile Range (IQR) | 6.0% | 6.7% |
| Standard Deviation (Sample) | 6.4% | 5.7% |
| Standard Deviation (Population) | 6.4% | 5.6% |
Similar Demographics by 11th Grade
Demographics Similar to Armenians by 11th Grade
In terms of 11th grade, the demographic groups most similar to Armenians are Subsaharan African (91.7%, a difference of 0.0%), Colombian (91.7%, a difference of 0.010%), Immigrants from Bolivia (91.7%, a difference of 0.010%), Cheyenne (91.8%, a difference of 0.030%), and Comanche (91.7%, a difference of 0.030%).
| Demographics | Rating | Rank | 11th Grade |
| Immigrants | Cameroon | 4.4 /100 | #227 | Tragic 91.8% |
| Immigrants | Panama | 4.3 /100 | #228 | Tragic 91.8% |
| Nigerians | 4.3 /100 | #229 | Tragic 91.8% |
| Immigrants | Afghanistan | 3.9 /100 | #230 | Tragic 91.8% |
| Choctaw | 3.7 /100 | #231 | Tragic 91.8% |
| Uruguayans | 3.5 /100 | #232 | Tragic 91.8% |
| Cheyenne | 3.3 /100 | #233 | Tragic 91.8% |
| Armenians | 2.9 /100 | #234 | Tragic 91.7% |
| Sub-Saharan Africans | 2.9 /100 | #235 | Tragic 91.7% |
| Colombians | 2.8 /100 | #236 | Tragic 91.7% |
| Immigrants | Bolivia | 2.8 /100 | #237 | Tragic 91.7% |
| Comanche | 2.6 /100 | #238 | Tragic 91.7% |
| Hopi | 2.5 /100 | #239 | Tragic 91.7% |
| South Americans | 2.0 /100 | #240 | Tragic 91.6% |
| Bahamians | 1.8 /100 | #241 | Tragic 91.6% |
Demographics Similar to Inupiat by 11th Grade
In terms of 11th grade, the demographic groups most similar to Inupiat are Creek (92.4%, a difference of 0.0%), Cherokee (92.4%, a difference of 0.0%), Immigrants from Morocco (92.4%, a difference of 0.020%), Sudanese (92.5%, a difference of 0.030%), and Immigrants from Malaysia (92.4%, a difference of 0.030%).
| Demographics | Rating | Rank | 11th Grade |
| Indians (Asian) | 51.5 /100 | #173 | Average 92.5% |
| Asians | 50.0 /100 | #174 | Average 92.5% |
| Shoshone | 48.9 /100 | #175 | Average 92.5% |
| Spaniards | 46.9 /100 | #176 | Average 92.5% |
| Guamanians/Chamorros | 45.0 /100 | #177 | Average 92.5% |
| Sudanese | 43.4 /100 | #178 | Average 92.5% |
| Creek | 40.9 /100 | #179 | Average 92.4% |
| Inupiat | 40.7 /100 | #180 | Average 92.4% |
| Cherokee | 40.7 /100 | #181 | Average 92.4% |
| Immigrants | Morocco | 38.6 /100 | #182 | Fair 92.4% |
| Immigrants | Malaysia | 37.6 /100 | #183 | Fair 92.4% |
| Immigrants | Asia | 37.4 /100 | #184 | Fair 92.4% |
| Immigrants | Nepal | 36.4 /100 | #185 | Fair 92.4% |
| Arapaho | 35.1 /100 | #186 | Fair 92.4% |
| Immigrants | Western Asia | 35.0 /100 | #187 | Fair 92.4% |