Scotch-Irish vs Immigrants from Uganda 8th Grade
COMPARE
Scotch-Irish
Immigrants from Uganda
8th Grade
8th Grade Comparison
Scotch-Irish
Immigrants from Uganda
97.1%
8TH GRADE
100.0/ 100
METRIC RATING
27th/ 347
METRIC RANK
95.6%
8TH GRADE
36.0/ 100
METRIC RATING
184th/ 347
METRIC RANK
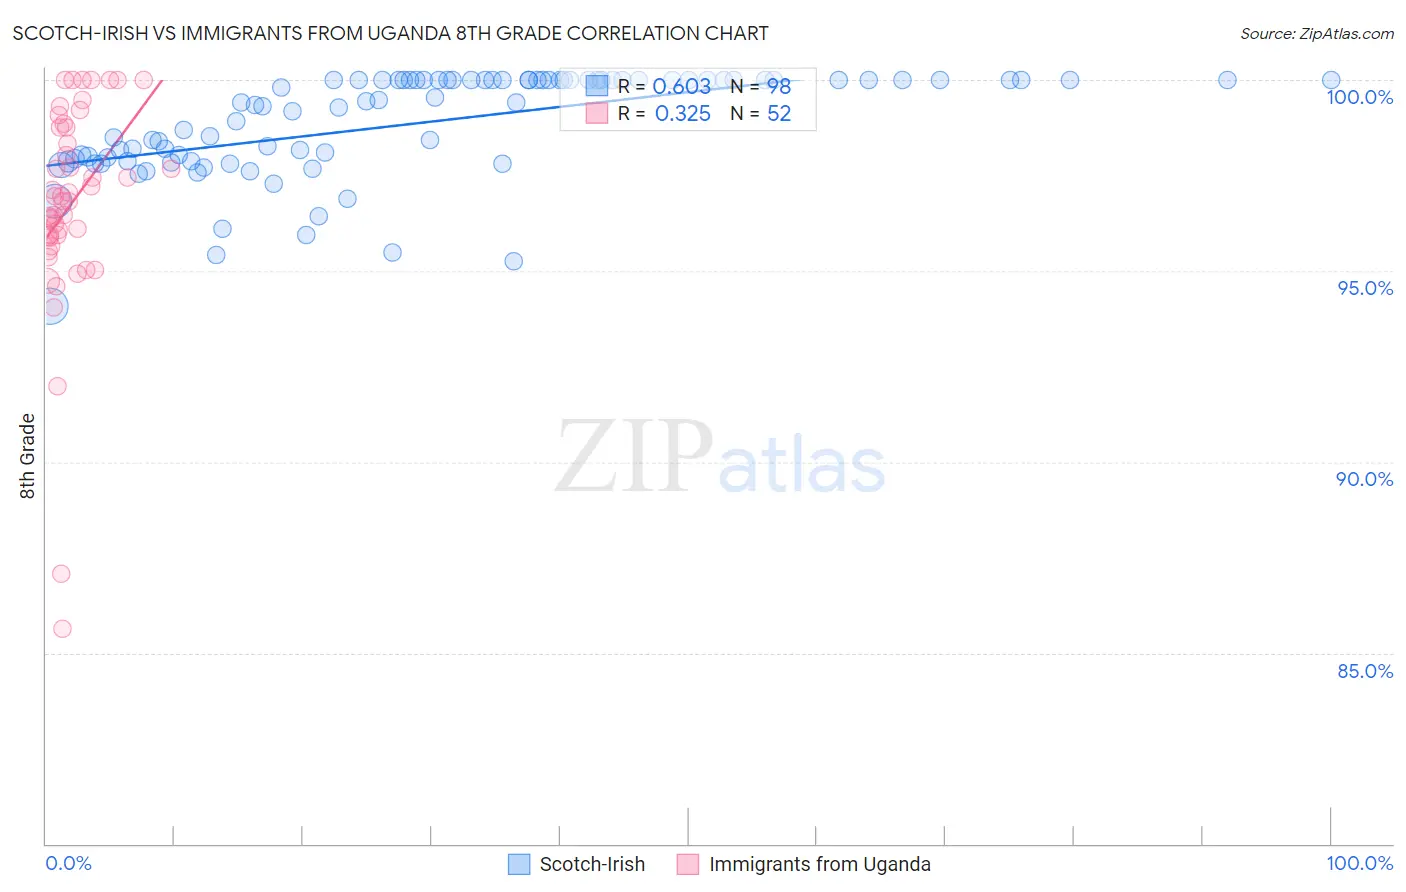
Scotch-Irish vs Immigrants from Uganda 8th Grade Correlation Chart
The statistical analysis conducted on geographies consisting of 548,777,407 people shows a significant positive correlation between the proportion of Scotch-Irish and percentage of population with at least 8th grade education in the United States with a correlation coefficient (R) of 0.603 and weighted average of 97.1%. Similarly, the statistical analysis conducted on geographies consisting of 125,943,496 people shows a mild positive correlation between the proportion of Immigrants from Uganda and percentage of population with at least 8th grade education in the United States with a correlation coefficient (R) of 0.325 and weighted average of 95.6%, a difference of 1.5%.
8th Grade Correlation Summary
| Measurement | Scotch-Irish | Immigrants from Uganda |
| Minimum | 94.1% | 85.6% |
| Maximum | 100.0% | 100.0% |
| Range | 5.9% | 14.4% |
| Mean | 98.9% | 96.7% |
| Median | 99.4% | 96.9% |
| Interquartile 25% (IQ1) | 97.9% | 95.9% |
| Interquartile 75% (IQ3) | 100.0% | 98.8% |
| Interquartile Range (IQR) | 2.1% | 2.9% |
| Standard Deviation (Sample) | 1.4% | 2.8% |
| Standard Deviation (Population) | 1.4% | 2.8% |
Similar Demographics by 8th Grade
Demographics Similar to Scotch-Irish by 8th Grade
In terms of 8th grade, the demographic groups most similar to Scotch-Irish are Italian (97.1%, a difference of 0.010%), European (97.1%, a difference of 0.010%), Czech (97.1%, a difference of 0.020%), French (97.1%, a difference of 0.020%), and Scandinavian (97.2%, a difference of 0.030%).
| Demographics | Rating | Rank | 8th Grade |
| Croatians | 100.0 /100 | #20 | Exceptional 97.2% |
| Danes | 100.0 /100 | #21 | Exceptional 97.2% |
| Welsh | 100.0 /100 | #22 | Exceptional 97.2% |
| French Canadians | 100.0 /100 | #23 | Exceptional 97.2% |
| Scandinavians | 100.0 /100 | #24 | Exceptional 97.2% |
| Czechs | 100.0 /100 | #25 | Exceptional 97.1% |
| French | 100.0 /100 | #26 | Exceptional 97.1% |
| Scotch-Irish | 100.0 /100 | #27 | Exceptional 97.1% |
| Italians | 100.0 /100 | #28 | Exceptional 97.1% |
| Europeans | 100.0 /100 | #29 | Exceptional 97.1% |
| Sioux | 100.0 /100 | #30 | Exceptional 97.1% |
| Chippewa | 100.0 /100 | #31 | Exceptional 97.1% |
| Yup'ik | 100.0 /100 | #32 | Exceptional 97.0% |
| Swiss | 100.0 /100 | #33 | Exceptional 97.0% |
| Luxembourgers | 100.0 /100 | #34 | Exceptional 97.0% |
Demographics Similar to Immigrants from Uganda by 8th Grade
In terms of 8th grade, the demographic groups most similar to Immigrants from Uganda are Immigrants from Iraq (95.6%, a difference of 0.0%), Immigrants from Egypt (95.7%, a difference of 0.010%), Black/African American (95.6%, a difference of 0.010%), Brazilian (95.6%, a difference of 0.010%), and Immigrants from Spain (95.7%, a difference of 0.020%).
| Demographics | Rating | Rank | 8th Grade |
| Marshallese | 47.6 /100 | #177 | Average 95.7% |
| Venezuelans | 47.5 /100 | #178 | Average 95.7% |
| Immigrants | Brazil | 45.4 /100 | #179 | Average 95.7% |
| Iraqis | 40.5 /100 | #180 | Average 95.7% |
| Immigrants | Spain | 38.7 /100 | #181 | Fair 95.7% |
| Immigrants | Egypt | 37.9 /100 | #182 | Fair 95.7% |
| Immigrants | Iraq | 36.2 /100 | #183 | Fair 95.6% |
| Immigrants | Uganda | 36.0 /100 | #184 | Fair 95.6% |
| Blacks/African Americans | 34.8 /100 | #185 | Fair 95.6% |
| Brazilians | 34.8 /100 | #186 | Fair 95.6% |
| Sudanese | 33.0 /100 | #187 | Fair 95.6% |
| Liberians | 32.4 /100 | #188 | Fair 95.6% |
| Immigrants | Micronesia | 31.6 /100 | #189 | Fair 95.6% |
| Immigrants | Venezuela | 30.8 /100 | #190 | Fair 95.6% |
| Immigrants | Nepal | 30.2 /100 | #191 | Fair 95.6% |