Zimbabwean vs Immigrants from Uganda 8th Grade
COMPARE
Zimbabwean
Immigrants from Uganda
8th Grade
8th Grade Comparison
Zimbabweans
Immigrants from Uganda
96.5%
8TH GRADE
99.4/ 100
METRIC RATING
75th/ 347
METRIC RANK
95.6%
8TH GRADE
36.0/ 100
METRIC RATING
184th/ 347
METRIC RANK
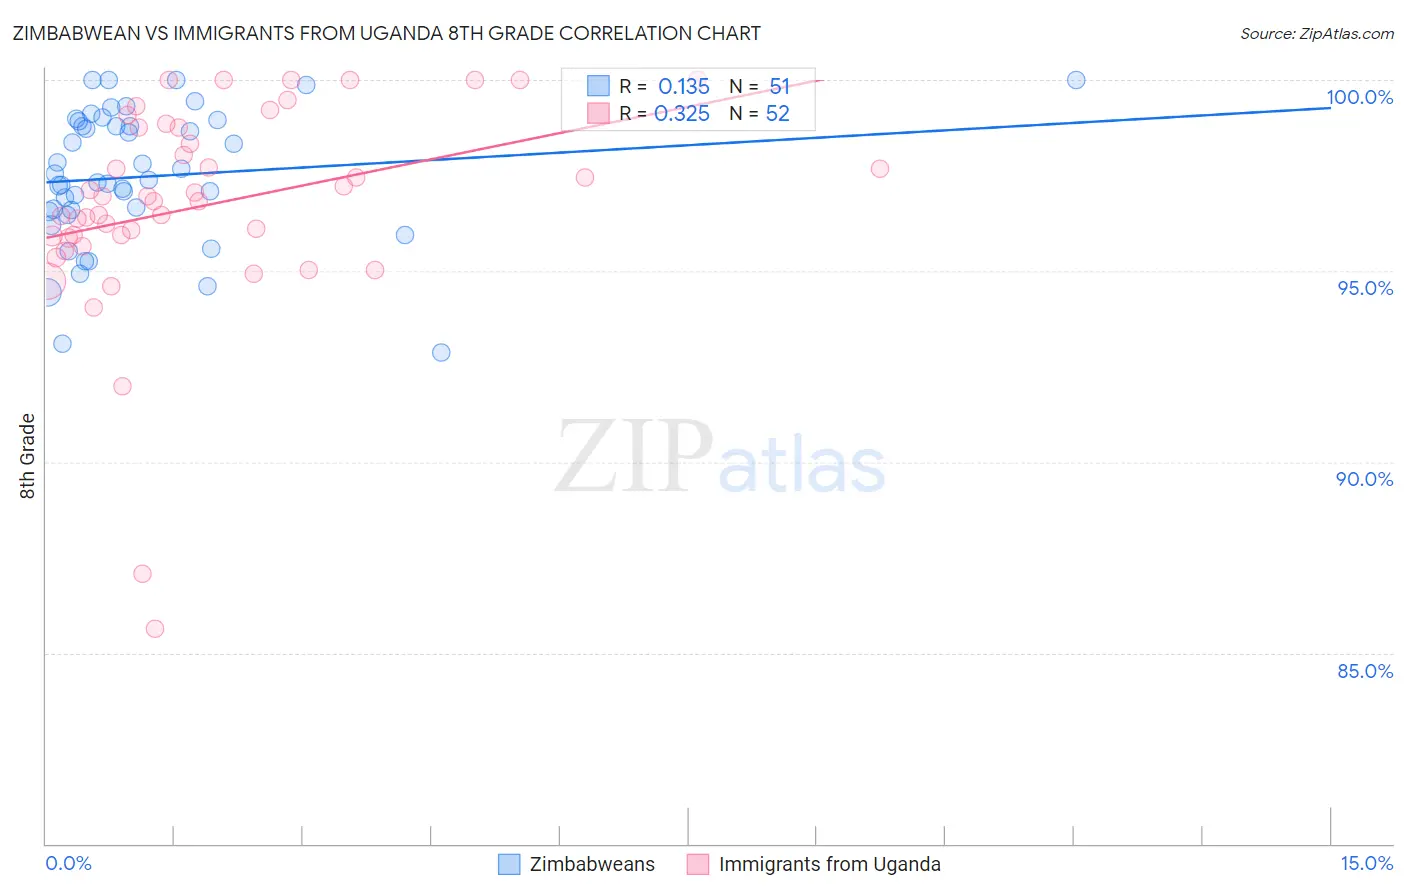
Zimbabwean vs Immigrants from Uganda 8th Grade Correlation Chart
The statistical analysis conducted on geographies consisting of 69,203,423 people shows a poor positive correlation between the proportion of Zimbabweans and percentage of population with at least 8th grade education in the United States with a correlation coefficient (R) of 0.135 and weighted average of 96.5%. Similarly, the statistical analysis conducted on geographies consisting of 125,943,496 people shows a mild positive correlation between the proportion of Immigrants from Uganda and percentage of population with at least 8th grade education in the United States with a correlation coefficient (R) of 0.325 and weighted average of 95.6%, a difference of 0.93%.
8th Grade Correlation Summary
| Measurement | Zimbabwean | Immigrants from Uganda |
| Minimum | 92.9% | 85.6% |
| Maximum | 100.0% | 100.0% |
| Range | 7.1% | 14.4% |
| Mean | 97.5% | 96.7% |
| Median | 97.4% | 96.9% |
| Interquartile 25% (IQ1) | 96.6% | 95.9% |
| Interquartile 75% (IQ3) | 98.9% | 98.8% |
| Interquartile Range (IQR) | 2.4% | 2.9% |
| Standard Deviation (Sample) | 1.8% | 2.8% |
| Standard Deviation (Population) | 1.7% | 2.8% |
Similar Demographics by 8th Grade
Demographics Similar to Zimbabweans by 8th Grade
In terms of 8th grade, the demographic groups most similar to Zimbabweans are Immigrants from Netherlands (96.5%, a difference of 0.0%), Immigrants from Ireland (96.5%, a difference of 0.010%), Cypriot (96.5%, a difference of 0.010%), Yugoslavian (96.5%, a difference of 0.010%), and New Zealander (96.6%, a difference of 0.020%).
| Demographics | Rating | Rank | 8th Grade |
| Creek | 99.7 /100 | #68 | Exceptional 96.6% |
| Americans | 99.7 /100 | #69 | Exceptional 96.6% |
| Immigrants | Lithuania | 99.6 /100 | #70 | Exceptional 96.6% |
| New Zealanders | 99.5 /100 | #71 | Exceptional 96.6% |
| Immigrants | England | 99.5 /100 | #72 | Exceptional 96.6% |
| Arapaho | 99.5 /100 | #73 | Exceptional 96.6% |
| Immigrants | Ireland | 99.5 /100 | #74 | Exceptional 96.5% |
| Zimbabweans | 99.4 /100 | #75 | Exceptional 96.5% |
| Immigrants | Netherlands | 99.4 /100 | #76 | Exceptional 96.5% |
| Cypriots | 99.4 /100 | #77 | Exceptional 96.5% |
| Yugoslavians | 99.4 /100 | #78 | Exceptional 96.5% |
| Puget Sound Salish | 99.3 /100 | #79 | Exceptional 96.5% |
| Delaware | 99.2 /100 | #80 | Exceptional 96.5% |
| Romanians | 99.2 /100 | #81 | Exceptional 96.5% |
| Turks | 99.2 /100 | #82 | Exceptional 96.5% |
Demographics Similar to Immigrants from Uganda by 8th Grade
In terms of 8th grade, the demographic groups most similar to Immigrants from Uganda are Immigrants from Iraq (95.6%, a difference of 0.0%), Immigrants from Egypt (95.7%, a difference of 0.010%), Black/African American (95.6%, a difference of 0.010%), Brazilian (95.6%, a difference of 0.010%), and Immigrants from Spain (95.7%, a difference of 0.020%).
| Demographics | Rating | Rank | 8th Grade |
| Marshallese | 47.6 /100 | #177 | Average 95.7% |
| Venezuelans | 47.5 /100 | #178 | Average 95.7% |
| Immigrants | Brazil | 45.4 /100 | #179 | Average 95.7% |
| Iraqis | 40.5 /100 | #180 | Average 95.7% |
| Immigrants | Spain | 38.7 /100 | #181 | Fair 95.7% |
| Immigrants | Egypt | 37.9 /100 | #182 | Fair 95.7% |
| Immigrants | Iraq | 36.2 /100 | #183 | Fair 95.6% |
| Immigrants | Uganda | 36.0 /100 | #184 | Fair 95.6% |
| Blacks/African Americans | 34.8 /100 | #185 | Fair 95.6% |
| Brazilians | 34.8 /100 | #186 | Fair 95.6% |
| Sudanese | 33.0 /100 | #187 | Fair 95.6% |
| Liberians | 32.4 /100 | #188 | Fair 95.6% |
| Immigrants | Micronesia | 31.6 /100 | #189 | Fair 95.6% |
| Immigrants | Venezuela | 30.8 /100 | #190 | Fair 95.6% |
| Immigrants | Nepal | 30.2 /100 | #191 | Fair 95.6% |