Scotch-Irish vs Immigrants from Panama 8th Grade
COMPARE
Scotch-Irish
Immigrants from Panama
8th Grade
8th Grade Comparison
Scotch-Irish
Immigrants from Panama
97.1%
8TH GRADE
100.0/ 100
METRIC RATING
27th/ 347
METRIC RANK
95.2%
8TH GRADE
4.1/ 100
METRIC RATING
230th/ 347
METRIC RANK
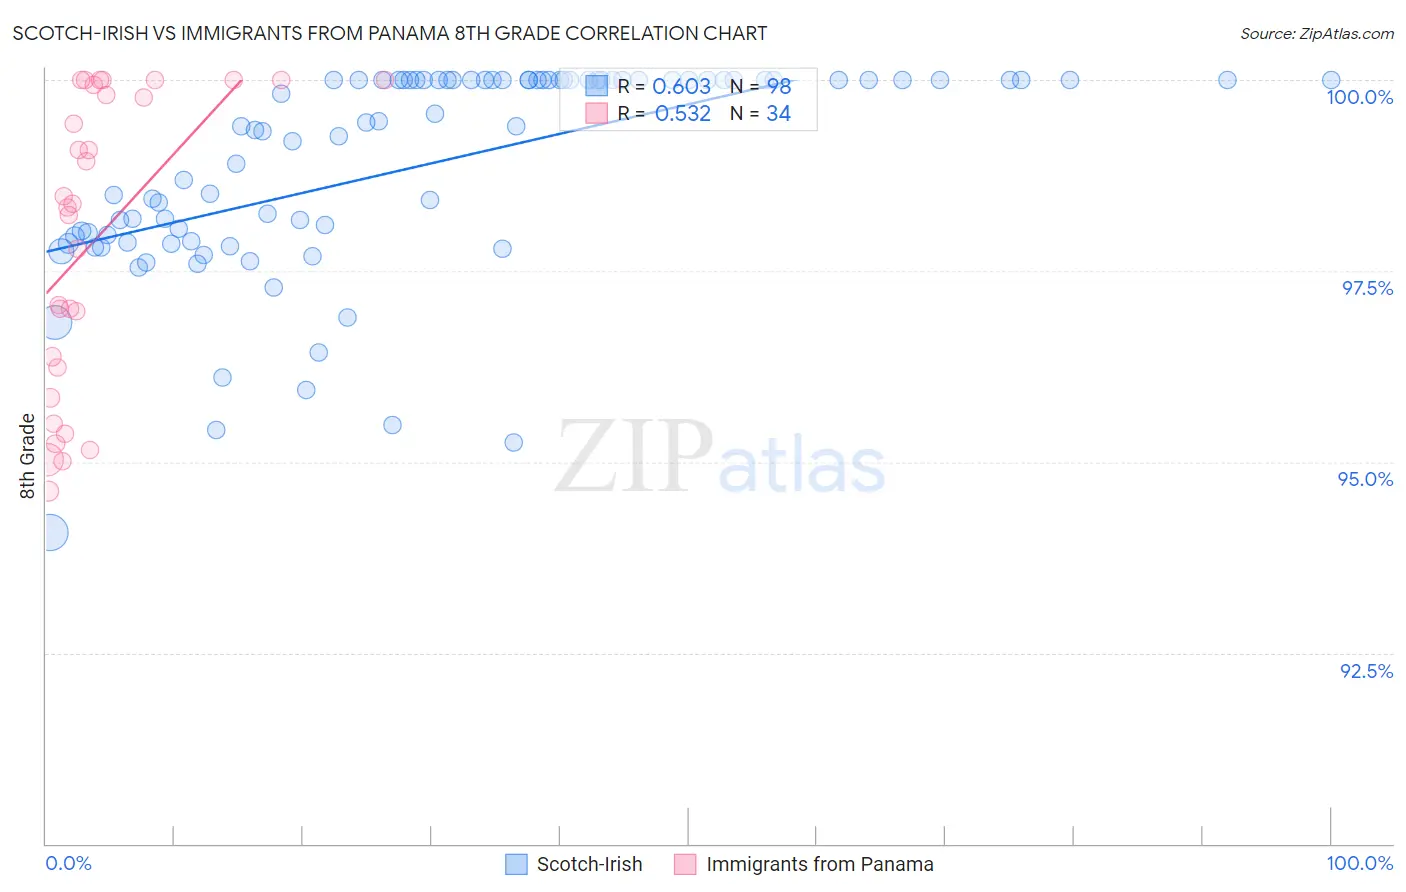
Scotch-Irish vs Immigrants from Panama 8th Grade Correlation Chart
The statistical analysis conducted on geographies consisting of 548,777,407 people shows a significant positive correlation between the proportion of Scotch-Irish and percentage of population with at least 8th grade education in the United States with a correlation coefficient (R) of 0.603 and weighted average of 97.1%. Similarly, the statistical analysis conducted on geographies consisting of 221,181,539 people shows a substantial positive correlation between the proportion of Immigrants from Panama and percentage of population with at least 8th grade education in the United States with a correlation coefficient (R) of 0.532 and weighted average of 95.2%, a difference of 2.0%.
8th Grade Correlation Summary
| Measurement | Scotch-Irish | Immigrants from Panama |
| Minimum | 94.1% | 94.6% |
| Maximum | 100.0% | 100.0% |
| Range | 5.9% | 5.4% |
| Mean | 98.9% | 97.9% |
| Median | 99.4% | 98.4% |
| Interquartile 25% (IQ1) | 97.9% | 96.2% |
| Interquartile 75% (IQ3) | 100.0% | 99.9% |
| Interquartile Range (IQR) | 2.1% | 3.7% |
| Standard Deviation (Sample) | 1.4% | 1.9% |
| Standard Deviation (Population) | 1.4% | 1.9% |
Similar Demographics by 8th Grade
Demographics Similar to Scotch-Irish by 8th Grade
In terms of 8th grade, the demographic groups most similar to Scotch-Irish are Italian (97.1%, a difference of 0.010%), European (97.1%, a difference of 0.010%), Czech (97.1%, a difference of 0.020%), French (97.1%, a difference of 0.020%), and Scandinavian (97.2%, a difference of 0.030%).
| Demographics | Rating | Rank | 8th Grade |
| Croatians | 100.0 /100 | #20 | Exceptional 97.2% |
| Danes | 100.0 /100 | #21 | Exceptional 97.2% |
| Welsh | 100.0 /100 | #22 | Exceptional 97.2% |
| French Canadians | 100.0 /100 | #23 | Exceptional 97.2% |
| Scandinavians | 100.0 /100 | #24 | Exceptional 97.2% |
| Czechs | 100.0 /100 | #25 | Exceptional 97.1% |
| French | 100.0 /100 | #26 | Exceptional 97.1% |
| Scotch-Irish | 100.0 /100 | #27 | Exceptional 97.1% |
| Italians | 100.0 /100 | #28 | Exceptional 97.1% |
| Europeans | 100.0 /100 | #29 | Exceptional 97.1% |
| Sioux | 100.0 /100 | #30 | Exceptional 97.1% |
| Chippewa | 100.0 /100 | #31 | Exceptional 97.1% |
| Yup'ik | 100.0 /100 | #32 | Exceptional 97.0% |
| Swiss | 100.0 /100 | #33 | Exceptional 97.0% |
| Luxembourgers | 100.0 /100 | #34 | Exceptional 97.0% |
Demographics Similar to Immigrants from Panama by 8th Grade
In terms of 8th grade, the demographic groups most similar to Immigrants from Panama are Immigrants from Indonesia (95.3%, a difference of 0.010%), Asian (95.2%, a difference of 0.030%), Indian (Asian) (95.2%, a difference of 0.030%), Bahamian (95.3%, a difference of 0.050%), and Immigrants from Eastern Africa (95.3%, a difference of 0.050%).
| Demographics | Rating | Rank | 8th Grade |
| Immigrants | Oceania | 7.1 /100 | #223 | Tragic 95.3% |
| Immigrants | Western Asia | 6.0 /100 | #224 | Tragic 95.3% |
| Sub-Saharan Africans | 6.0 /100 | #225 | Tragic 95.3% |
| Navajo | 5.7 /100 | #226 | Tragic 95.3% |
| Bahamians | 5.6 /100 | #227 | Tragic 95.3% |
| Immigrants | Eastern Africa | 5.6 /100 | #228 | Tragic 95.3% |
| Immigrants | Indonesia | 4.4 /100 | #229 | Tragic 95.3% |
| Immigrants | Panama | 4.1 /100 | #230 | Tragic 95.2% |
| Asians | 3.5 /100 | #231 | Tragic 95.2% |
| Indians (Asian) | 3.3 /100 | #232 | Tragic 95.2% |
| Immigrants | Asia | 3.1 /100 | #233 | Tragic 95.2% |
| Costa Ricans | 3.0 /100 | #234 | Tragic 95.2% |
| Nigerians | 2.9 /100 | #235 | Tragic 95.2% |
| Senegalese | 2.7 /100 | #236 | Tragic 95.2% |
| Immigrants | Africa | 2.7 /100 | #237 | Tragic 95.2% |