Scotch-Irish vs Immigrants from Uganda Family Households
COMPARE
Scotch-Irish
Immigrants from Uganda
Family Households
Family Households Comparison
Scotch-Irish
Immigrants from Uganda
64.4%
FAMILY HOUSEHOLDS
59.2/ 100
METRIC RATING
166th/ 347
METRIC RANK
62.7%
FAMILY HOUSEHOLDS
0.1/ 100
METRIC RATING
288th/ 347
METRIC RANK
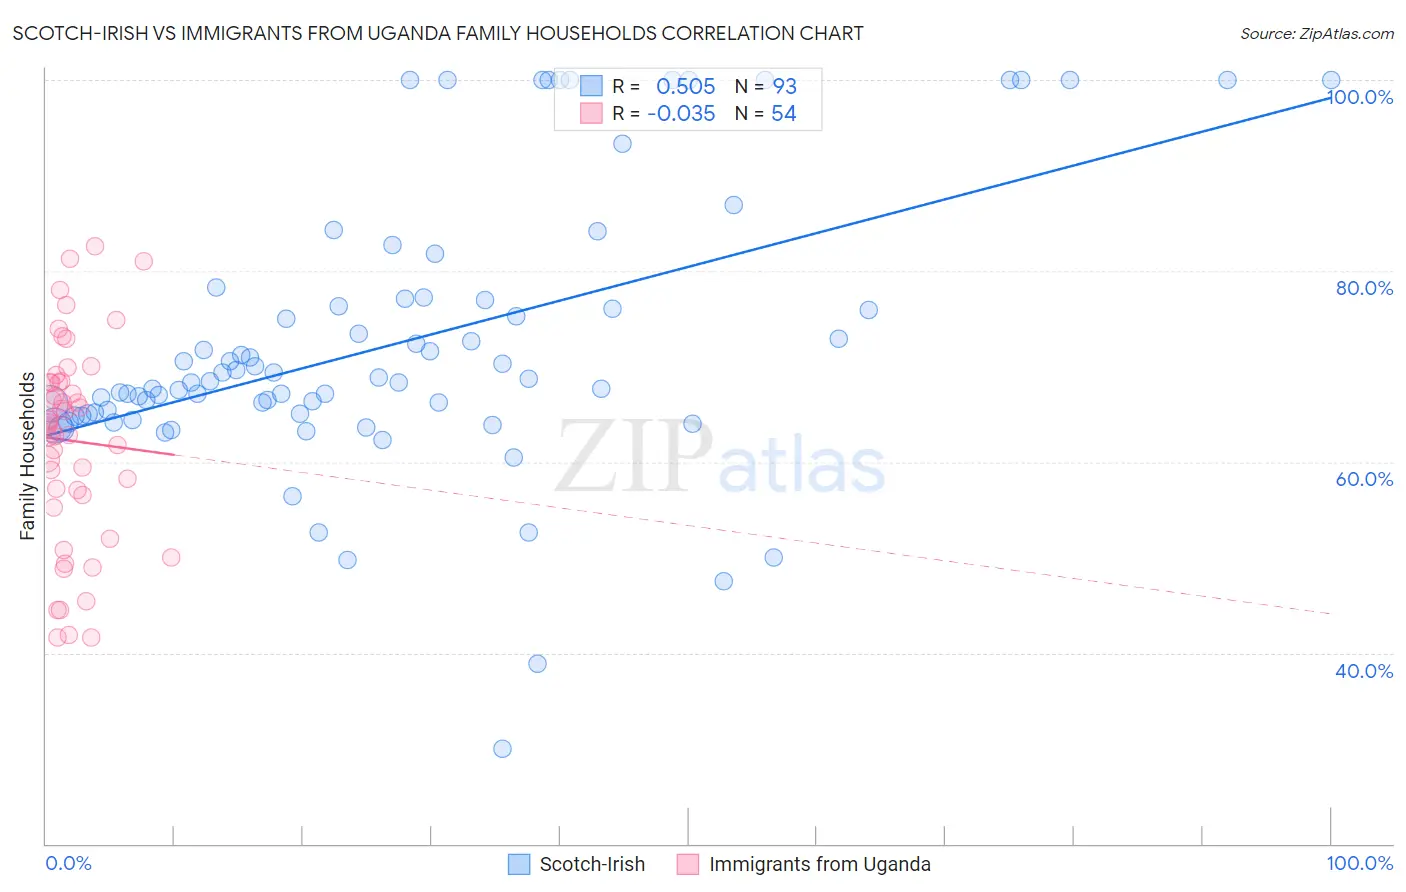
Scotch-Irish vs Immigrants from Uganda Family Households Correlation Chart
The statistical analysis conducted on geographies consisting of 548,372,963 people shows a substantial positive correlation between the proportion of Scotch-Irish and percentage of family households in the United States with a correlation coefficient (R) of 0.505 and weighted average of 64.4%. Similarly, the statistical analysis conducted on geographies consisting of 125,974,849 people shows no correlation between the proportion of Immigrants from Uganda and percentage of family households in the United States with a correlation coefficient (R) of -0.035 and weighted average of 62.7%, a difference of 2.6%.
Family Households Correlation Summary
| Measurement | Scotch-Irish | Immigrants from Uganda |
| Minimum | 29.9% | 41.7% |
| Maximum | 100.0% | 82.6% |
| Range | 70.1% | 40.9% |
| Mean | 72.5% | 62.2% |
| Median | 68.4% | 63.9% |
| Interquartile 25% (IQ1) | 64.9% | 56.5% |
| Interquartile 75% (IQ3) | 77.0% | 68.3% |
| Interquartile Range (IQR) | 12.1% | 11.9% |
| Standard Deviation (Sample) | 14.6% | 10.5% |
| Standard Deviation (Population) | 14.5% | 10.4% |
Similar Demographics by Family Households
Demographics Similar to Scotch-Irish by Family Households
In terms of family households, the demographic groups most similar to Scotch-Irish are Immigrants from Nigeria (64.4%, a difference of 0.010%), Immigrants from Southern Europe (64.4%, a difference of 0.010%), Irish (64.4%, a difference of 0.020%), Honduran (64.4%, a difference of 0.020%), and British (64.4%, a difference of 0.030%).
| Demographics | Rating | Rank | Family Households |
| Germans | 65.8 /100 | #159 | Good 64.4% |
| Immigrants | Moldova | 65.2 /100 | #160 | Good 64.4% |
| Immigrants | England | 62.6 /100 | #161 | Good 64.4% |
| British | 61.6 /100 | #162 | Good 64.4% |
| Chickasaw | 61.5 /100 | #163 | Good 64.4% |
| Immigrants | Nigeria | 60.1 /100 | #164 | Good 64.4% |
| Immigrants | Southern Europe | 60.0 /100 | #165 | Good 64.4% |
| Scotch-Irish | 59.2 /100 | #166 | Average 64.4% |
| Irish | 57.9 /100 | #167 | Average 64.4% |
| Hondurans | 57.5 /100 | #168 | Average 64.4% |
| Iraqis | 56.0 /100 | #169 | Average 64.4% |
| Armenians | 55.9 /100 | #170 | Average 64.4% |
| Ute | 54.6 /100 | #171 | Average 64.3% |
| Dutch West Indians | 53.9 /100 | #172 | Average 64.3% |
| Immigrants | Sierra Leone | 52.5 /100 | #173 | Average 64.3% |
Demographics Similar to Immigrants from Uganda by Family Households
In terms of family households, the demographic groups most similar to Immigrants from Uganda are British West Indian (62.8%, a difference of 0.020%), Latvian (62.8%, a difference of 0.020%), Mongolian (62.8%, a difference of 0.050%), Immigrants from Nepal (62.7%, a difference of 0.090%), and Australian (62.8%, a difference of 0.16%).
| Demographics | Rating | Rank | Family Households |
| Estonians | 0.2 /100 | #281 | Tragic 62.9% |
| New Zealanders | 0.1 /100 | #282 | Tragic 62.9% |
| Immigrants | Denmark | 0.1 /100 | #283 | Tragic 62.9% |
| Australians | 0.1 /100 | #284 | Tragic 62.8% |
| Mongolians | 0.1 /100 | #285 | Tragic 62.8% |
| British West Indians | 0.1 /100 | #286 | Tragic 62.8% |
| Latvians | 0.1 /100 | #287 | Tragic 62.8% |
| Immigrants | Uganda | 0.1 /100 | #288 | Tragic 62.7% |
| Immigrants | Nepal | 0.1 /100 | #289 | Tragic 62.7% |
| Immigrants | Grenada | 0.0 /100 | #290 | Tragic 62.6% |
| U.S. Virgin Islanders | 0.0 /100 | #291 | Tragic 62.6% |
| Immigrants | Burma/Myanmar | 0.0 /100 | #292 | Tragic 62.6% |
| Immigrants | Sweden | 0.0 /100 | #293 | Tragic 62.5% |
| Barbadians | 0.0 /100 | #294 | Tragic 62.5% |
| Okinawans | 0.0 /100 | #295 | Tragic 62.5% |