Scotch-Irish vs Immigrants from England 8th Grade
COMPARE
Scotch-Irish
Immigrants from England
8th Grade
8th Grade Comparison
Scotch-Irish
Immigrants from England
97.1%
8TH GRADE
100.0/ 100
METRIC RATING
27th/ 347
METRIC RANK
96.6%
8TH GRADE
99.5/ 100
METRIC RATING
72nd/ 347
METRIC RANK
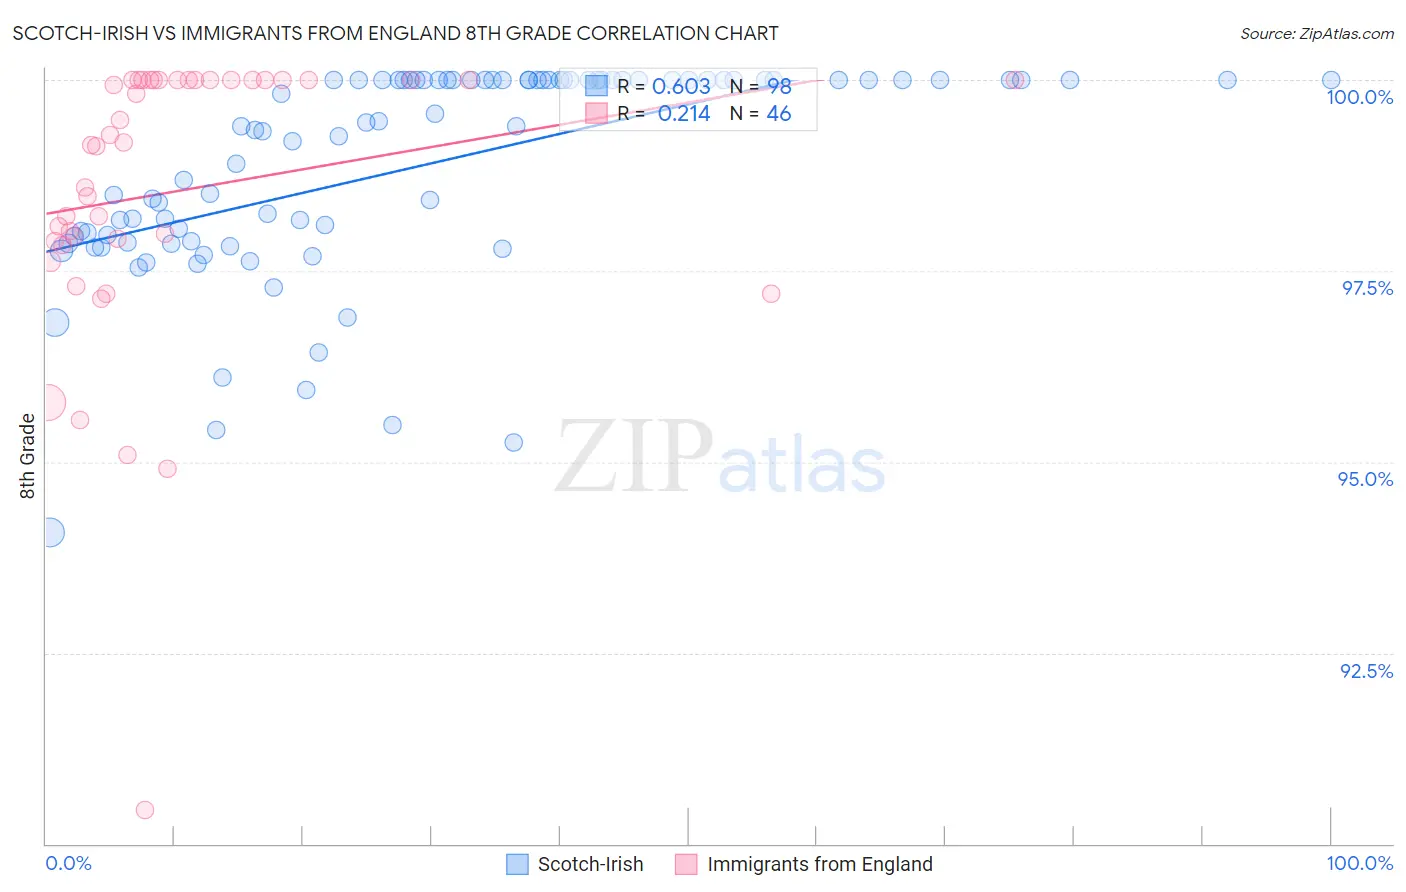
Scotch-Irish vs Immigrants from England 8th Grade Correlation Chart
The statistical analysis conducted on geographies consisting of 548,777,407 people shows a significant positive correlation between the proportion of Scotch-Irish and percentage of population with at least 8th grade education in the United States with a correlation coefficient (R) of 0.603 and weighted average of 97.1%. Similarly, the statistical analysis conducted on geographies consisting of 391,897,780 people shows a weak positive correlation between the proportion of Immigrants from England and percentage of population with at least 8th grade education in the United States with a correlation coefficient (R) of 0.214 and weighted average of 96.6%, a difference of 0.59%.
8th Grade Correlation Summary
| Measurement | Scotch-Irish | Immigrants from England |
| Minimum | 94.1% | 90.4% |
| Maximum | 100.0% | 100.0% |
| Range | 5.9% | 9.6% |
| Mean | 98.9% | 98.6% |
| Median | 99.4% | 99.2% |
| Interquartile 25% (IQ1) | 97.9% | 97.9% |
| Interquartile 75% (IQ3) | 100.0% | 100.0% |
| Interquartile Range (IQR) | 2.1% | 2.1% |
| Standard Deviation (Sample) | 1.4% | 1.9% |
| Standard Deviation (Population) | 1.4% | 1.9% |
Similar Demographics by 8th Grade
Demographics Similar to Scotch-Irish by 8th Grade
In terms of 8th grade, the demographic groups most similar to Scotch-Irish are Italian (97.1%, a difference of 0.010%), European (97.1%, a difference of 0.010%), Czech (97.1%, a difference of 0.020%), French (97.1%, a difference of 0.020%), and Scandinavian (97.2%, a difference of 0.030%).
| Demographics | Rating | Rank | 8th Grade |
| Croatians | 100.0 /100 | #20 | Exceptional 97.2% |
| Danes | 100.0 /100 | #21 | Exceptional 97.2% |
| Welsh | 100.0 /100 | #22 | Exceptional 97.2% |
| French Canadians | 100.0 /100 | #23 | Exceptional 97.2% |
| Scandinavians | 100.0 /100 | #24 | Exceptional 97.2% |
| Czechs | 100.0 /100 | #25 | Exceptional 97.1% |
| French | 100.0 /100 | #26 | Exceptional 97.1% |
| Scotch-Irish | 100.0 /100 | #27 | Exceptional 97.1% |
| Italians | 100.0 /100 | #28 | Exceptional 97.1% |
| Europeans | 100.0 /100 | #29 | Exceptional 97.1% |
| Sioux | 100.0 /100 | #30 | Exceptional 97.1% |
| Chippewa | 100.0 /100 | #31 | Exceptional 97.1% |
| Yup'ik | 100.0 /100 | #32 | Exceptional 97.0% |
| Swiss | 100.0 /100 | #33 | Exceptional 97.0% |
| Luxembourgers | 100.0 /100 | #34 | Exceptional 97.0% |
Demographics Similar to Immigrants from England by 8th Grade
In terms of 8th grade, the demographic groups most similar to Immigrants from England are New Zealander (96.6%, a difference of 0.0%), Arapaho (96.6%, a difference of 0.0%), Immigrants from Ireland (96.5%, a difference of 0.010%), Zimbabwean (96.5%, a difference of 0.020%), and Immigrants from Netherlands (96.5%, a difference of 0.020%).
| Demographics | Rating | Rank | 8th Grade |
| Native Hawaiians | 99.7 /100 | #65 | Exceptional 96.6% |
| Canadians | 99.7 /100 | #66 | Exceptional 96.6% |
| Iranians | 99.7 /100 | #67 | Exceptional 96.6% |
| Creek | 99.7 /100 | #68 | Exceptional 96.6% |
| Americans | 99.7 /100 | #69 | Exceptional 96.6% |
| Immigrants | Lithuania | 99.6 /100 | #70 | Exceptional 96.6% |
| New Zealanders | 99.5 /100 | #71 | Exceptional 96.6% |
| Immigrants | England | 99.5 /100 | #72 | Exceptional 96.6% |
| Arapaho | 99.5 /100 | #73 | Exceptional 96.6% |
| Immigrants | Ireland | 99.5 /100 | #74 | Exceptional 96.5% |
| Zimbabweans | 99.4 /100 | #75 | Exceptional 96.5% |
| Immigrants | Netherlands | 99.4 /100 | #76 | Exceptional 96.5% |
| Cypriots | 99.4 /100 | #77 | Exceptional 96.5% |
| Yugoslavians | 99.4 /100 | #78 | Exceptional 96.5% |
| Puget Sound Salish | 99.3 /100 | #79 | Exceptional 96.5% |