Scotch-Irish vs Immigrants from Uganda Unemployment Among Ages 16 to 19 years
COMPARE
Scotch-Irish
Immigrants from Uganda
Unemployment Among Ages 16 to 19 years
Unemployment Among Ages 16 to 19 years Comparison
Scotch-Irish
Immigrants from Uganda
16.6%
UNEMPLOYMENT AMONG AGES 16 TO 19 YEARS
99.1/ 100
METRIC RATING
63rd/ 347
METRIC RANK
16.5%
UNEMPLOYMENT AMONG AGES 16 TO 19 YEARS
99.4/ 100
METRIC RATING
58th/ 347
METRIC RANK
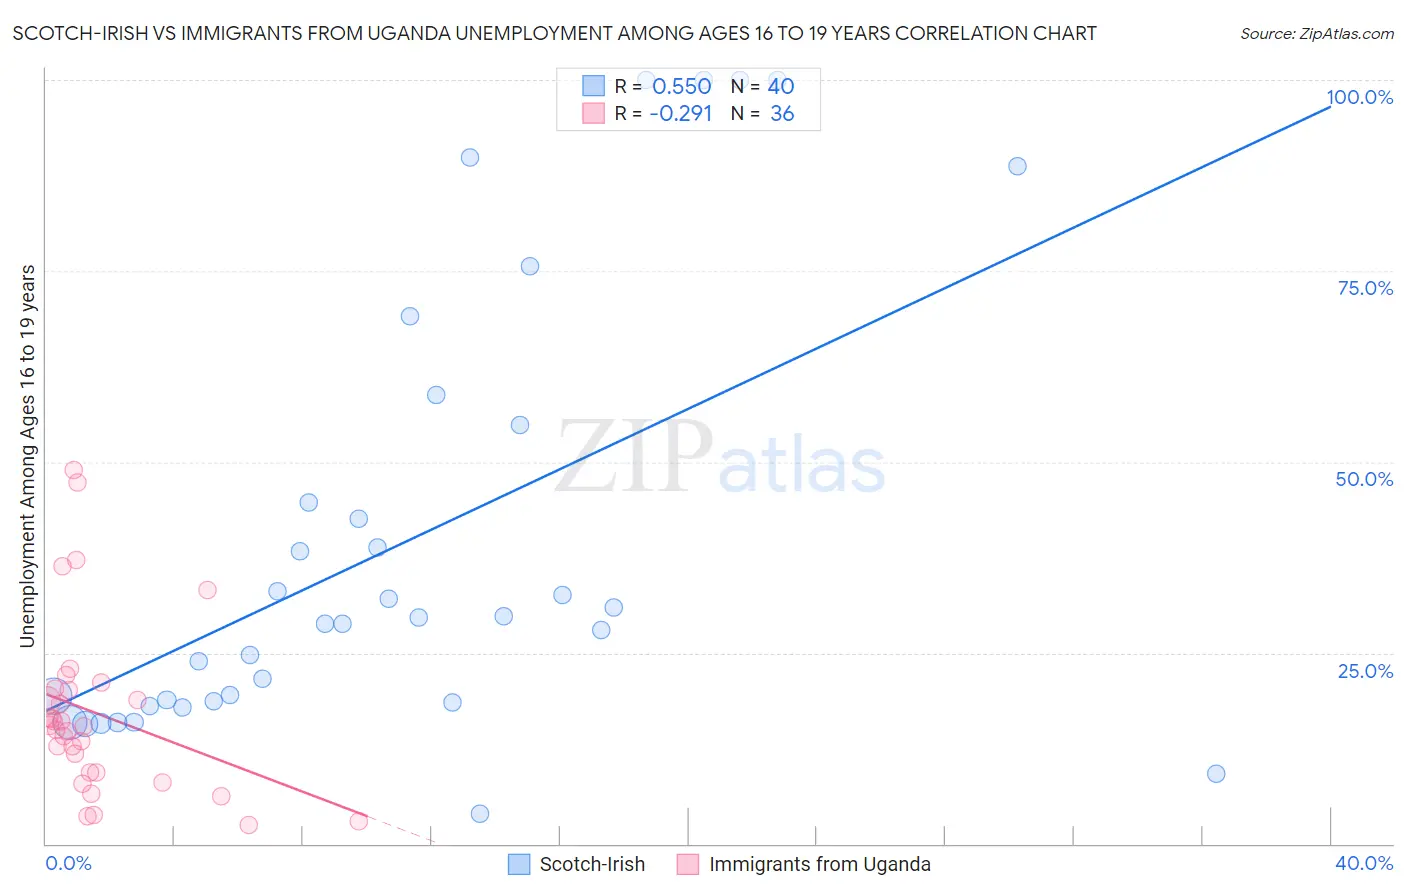
Scotch-Irish vs Immigrants from Uganda Unemployment Among Ages 16 to 19 years Correlation Chart
The statistical analysis conducted on geographies consisting of 491,977,609 people shows a substantial positive correlation between the proportion of Scotch-Irish and unemployment rate among population between the ages 16 and 19 in the United States with a correlation coefficient (R) of 0.550 and weighted average of 16.6%. Similarly, the statistical analysis conducted on geographies consisting of 124,056,467 people shows a weak negative correlation between the proportion of Immigrants from Uganda and unemployment rate among population between the ages 16 and 19 in the United States with a correlation coefficient (R) of -0.291 and weighted average of 16.5%, a difference of 0.56%.
Unemployment Among Ages 16 to 19 years Correlation Summary
| Measurement | Scotch-Irish | Immigrants from Uganda |
| Minimum | 3.9% | 2.4% |
| Maximum | 100.0% | 48.9% |
| Range | 96.1% | 46.5% |
| Mean | 39.2% | 17.1% |
| Median | 29.2% | 15.4% |
| Interquartile 25% (IQ1) | 18.6% | 9.3% |
| Interquartile 75% (IQ3) | 49.8% | 20.2% |
| Interquartile Range (IQR) | 31.2% | 10.9% |
| Standard Deviation (Sample) | 28.6% | 11.3% |
| Standard Deviation (Population) | 28.3% | 11.1% |
Demographics Similar to Scotch-Irish and Immigrants from Uganda by Unemployment Among Ages 16 to 19 years
In terms of unemployment among ages 16 to 19 years, the demographic groups most similar to Scotch-Irish are Northern European (16.6%, a difference of 0.070%), Immigrants from Japan (16.6%, a difference of 0.16%), Macedonian (16.6%, a difference of 0.18%), Okinawan (16.6%, a difference of 0.20%), and Immigrants from Cuba (16.6%, a difference of 0.28%). Similarly, the demographic groups most similar to Immigrants from Uganda are Immigrants from Jordan (16.5%, a difference of 0.050%), Irish (16.5%, a difference of 0.050%), Menominee (16.6%, a difference of 0.22%), Immigrants from Cuba (16.6%, a difference of 0.28%), and Sri Lankan (16.5%, a difference of 0.33%).
| Demographics | Rating | Rank | Unemployment Among Ages 16 to 19 years |
| Bhutanese | 99.6 /100 | #50 | Exceptional 16.4% |
| Lebanese | 99.6 /100 | #51 | Exceptional 16.4% |
| Welsh | 99.6 /100 | #52 | Exceptional 16.4% |
| Slovenes | 99.6 /100 | #53 | Exceptional 16.4% |
| British | 99.5 /100 | #54 | Exceptional 16.5% |
| Czechoslovakians | 99.5 /100 | #55 | Exceptional 16.5% |
| Sri Lankans | 99.5 /100 | #56 | Exceptional 16.5% |
| Immigrants | Jordan | 99.4 /100 | #57 | Exceptional 16.5% |
| Immigrants | Uganda | 99.4 /100 | #58 | Exceptional 16.5% |
| Irish | 99.4 /100 | #59 | Exceptional 16.5% |
| Menominee | 99.3 /100 | #60 | Exceptional 16.6% |
| Immigrants | Cuba | 99.2 /100 | #61 | Exceptional 16.6% |
| Macedonians | 99.2 /100 | #62 | Exceptional 16.6% |
| Scotch-Irish | 99.1 /100 | #63 | Exceptional 16.6% |
| Northern Europeans | 99.0 /100 | #64 | Exceptional 16.6% |
| Immigrants | Japan | 98.9 /100 | #65 | Exceptional 16.6% |
| Okinawans | 98.9 /100 | #66 | Exceptional 16.6% |
| Slavs | 98.7 /100 | #67 | Exceptional 16.7% |
| Chickasaw | 98.7 /100 | #68 | Exceptional 16.7% |
| Serbians | 98.7 /100 | #69 | Exceptional 16.7% |
| Austrians | 98.6 /100 | #70 | Exceptional 16.7% |