South American Indian vs Irish College, Under 1 year
COMPARE
South American Indian
Irish
College, Under 1 year
College, Under 1 year Comparison
South American Indians
Irish
65.5%
COLLEGE, UNDER 1 YEAR
54.4/ 100
METRIC RATING
172nd/ 347
METRIC RANK
66.0%
COLLEGE, UNDER 1 YEAR
70.3/ 100
METRIC RATING
155th/ 347
METRIC RANK
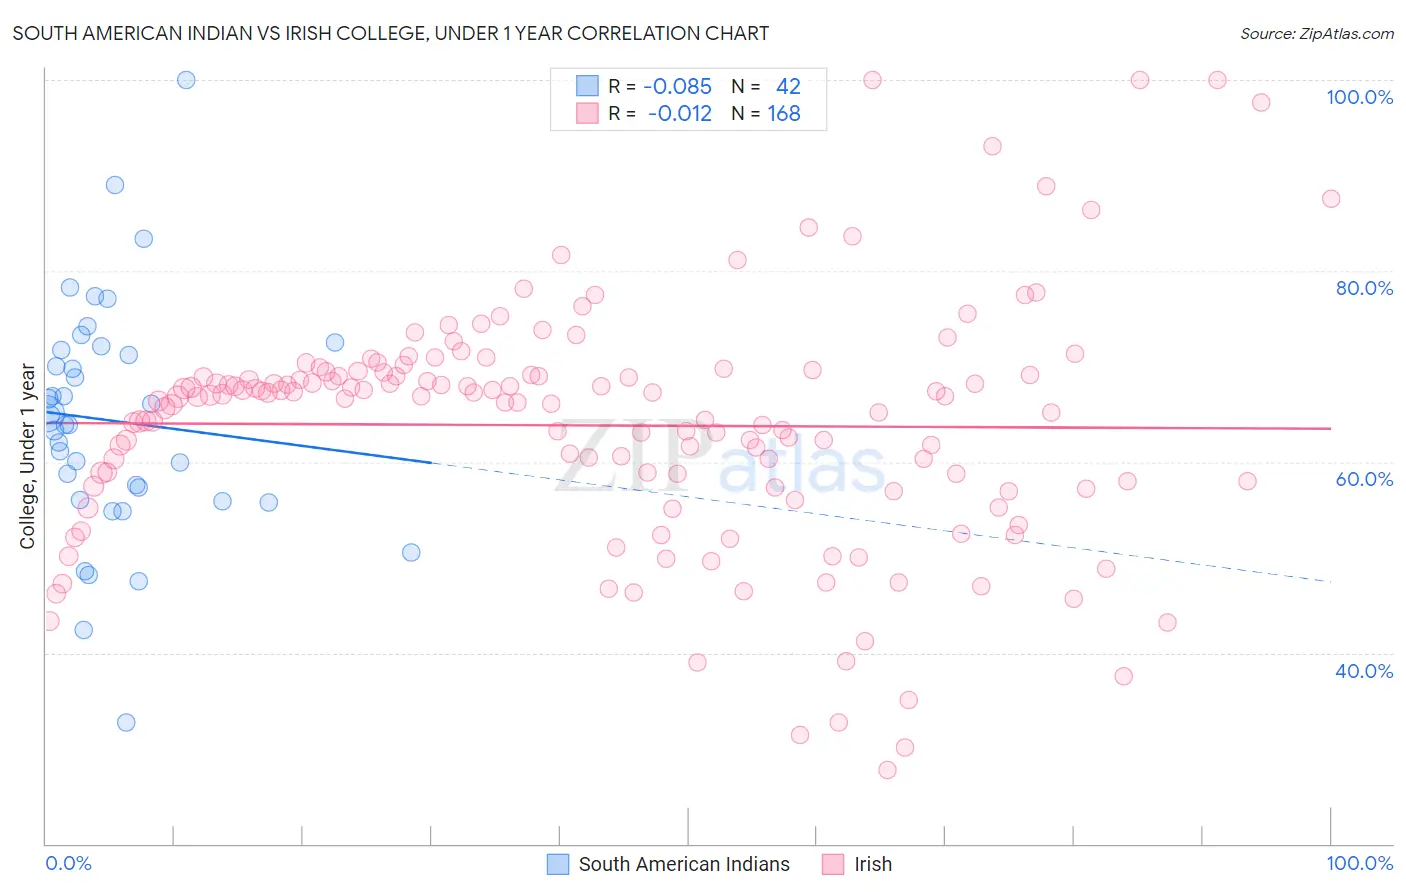
South American Indian vs Irish College, Under 1 year Correlation Chart
The statistical analysis conducted on geographies consisting of 164,573,280 people shows a slight negative correlation between the proportion of South American Indians and percentage of population with at least college, under 1 year education in the United States with a correlation coefficient (R) of -0.085 and weighted average of 65.5%. Similarly, the statistical analysis conducted on geographies consisting of 580,693,587 people shows no correlation between the proportion of Irish and percentage of population with at least college, under 1 year education in the United States with a correlation coefficient (R) of -0.012 and weighted average of 66.0%, a difference of 0.75%.
College, Under 1 year Correlation Summary
| Measurement | South American Indian | Irish |
| Minimum | 32.7% | 27.7% |
| Maximum | 100.0% | 100.0% |
| Range | 67.3% | 72.3% |
| Mean | 64.3% | 63.8% |
| Median | 64.4% | 66.7% |
| Interquartile 25% (IQ1) | 56.0% | 57.4% |
| Interquartile 75% (IQ3) | 71.7% | 69.1% |
| Interquartile Range (IQR) | 15.7% | 11.7% |
| Standard Deviation (Sample) | 12.4% | 12.6% |
| Standard Deviation (Population) | 12.3% | 12.6% |
Demographics Similar to South American Indians and Irish by College, Under 1 year
In terms of college, under 1 year, the demographic groups most similar to South American Indians are Swiss (65.5%, a difference of 0.020%), Immigrants from Oceania (65.6%, a difference of 0.030%), Yugoslavian (65.6%, a difference of 0.060%), German (65.6%, a difference of 0.060%), and Hungarian (65.6%, a difference of 0.070%). Similarly, the demographic groups most similar to Irish are Welsh (66.0%, a difference of 0.020%), Immigrants from Eritrea (66.1%, a difference of 0.090%), Sierra Leonean (66.0%, a difference of 0.12%), Celtic (65.9%, a difference of 0.15%), and Belgian (66.2%, a difference of 0.18%).
| Demographics | Rating | Rank | College, Under 1 year |
| Belgians | 73.7 /100 | #153 | Good 66.2% |
| Immigrants | Eritrea | 71.9 /100 | #154 | Good 66.1% |
| Irish | 70.3 /100 | #155 | Good 66.0% |
| Welsh | 69.9 /100 | #156 | Good 66.0% |
| Sierra Leoneans | 67.8 /100 | #157 | Good 66.0% |
| Celtics | 67.3 /100 | #158 | Good 65.9% |
| Tlingit-Haida | 66.4 /100 | #159 | Good 65.9% |
| Albanians | 66.1 /100 | #160 | Good 65.9% |
| Brazilians | 66.0 /100 | #161 | Good 65.9% |
| Koreans | 65.3 /100 | #162 | Good 65.9% |
| Somalis | 62.7 /100 | #163 | Good 65.8% |
| Czechoslovakians | 62.6 /100 | #164 | Good 65.8% |
| Immigrants | Uzbekistan | 61.6 /100 | #165 | Good 65.8% |
| Moroccans | 56.7 /100 | #166 | Average 65.6% |
| Immigrants | Somalia | 56.4 /100 | #167 | Average 65.6% |
| Hungarians | 55.9 /100 | #168 | Average 65.6% |
| Yugoslavians | 55.7 /100 | #169 | Average 65.6% |
| Germans | 55.7 /100 | #170 | Average 65.6% |
| Immigrants | Oceania | 55.0 /100 | #171 | Average 65.6% |
| South American Indians | 54.4 /100 | #172 | Average 65.5% |
| Swiss | 53.9 /100 | #173 | Average 65.5% |