Immigrants from Philippines vs Irish College, Under 1 year

COMPARE

Immigrants from Philippines
Race
Ancestry
AfghanAfricanAlaska NativeAlaskan AthabascanAlbanianAleutAlsatianAmericanApacheArabArapahoArgentineanArmenianAssyrian/Chaldean/SyriacAustralianAustrianBahamianBangladeshiBarbadianBasqueBelgianBelizeanBermudanBhutaneseBlackfeetBolivianBrazilianBritishBritish West IndianBulgarianBurmeseCajunCambodianCanadianCape VerdeanCarpatho RusynCelticCentral AmericanCentral American IndianCherokeeCheyenneChickasawChileanChineseChippewaChoctawColombianColvilleComancheCosta RicanCreeCreekCroatianCrowCubanCypriotCzechCzechoslovakianDanishDelawareDominicanDutchDutch West IndianEastern EuropeanEcuadorianEgyptianEnglishEstonianEthiopianEuropeanFijianFilipinoFinnishFrenchFrench American IndianFrench CanadianGermanGerman RussianGhanaianGreekGuamanian/ChamorroGuatemalanGuyaneseHaitianHmongHonduranHopiHoumaHungarianIcelanderIndian (Asian)IndonesianInupiatIranianIraqiIroquoisIsraeliItalianJamaicanJapaneseJordanianKenyanKiowaKoreanLaotianLatvianLebaneseLiberianLithuanianLumbeeLuxembourgerMacedonianMalaysianMalteseMarshalleseMenomineeMexicanMexican American IndianMongolianMoroccanNative HawaiianNavajoNepaleseNew ZealanderNicaraguanNigerianNorthern EuropeanNorwegianOkinawanOsageOttawaPaiutePakistaniPalestinianPanamanianParaguayanPennsylvania GermanPeruvianPimaPolishPortuguesePotawatomiPuebloPuerto RicanPuget Sound SalishRomanianRussianSalvadoranSamoanScandinavianScotch-IrishScottishSeminoleSenegaleseSerbianShoshoneSierra LeoneanSiouxSlavicSlovakSloveneSomaliSouth AfricanSouth AmericanSouth American IndianSoviet UnionSpaniardSpanishSpanish AmericanSpanish American IndianSri LankanSubsaharan AfricanSudaneseSwedishSwissSyrianTaiwaneseThaiTlingit-HaidaTohono O'OdhamTonganTrinidadian and TobagonianTsimshianTurkishU.S. Virgin IslanderUgandanUkrainianUruguayanUteVenezuelanVietnameseWelshWest IndianYakamaYaquiYugoslavianYumanYup'ikZimbabwean
Immigration
NonimmigrantsImmigrantsAfghanistanAfricaAlbaniaArgentinaArmeniaAsiaAustraliaAustriaBahamasBangladeshBarbadosBelarusBelgiumBelizeBoliviaBosnia and HerzegovinaBrazilBulgariaBurma/MyanmarCabo VerdeCambodiaCameroonCanadaCaribbeanCentral AmericaChileChinaColombiaCongoCosta RicaCroatiaCubaCzechoslovakiaDenmarkDominicaDominican RepublicEastern AfricaEastern AsiaEastern EuropeEcuadorEgyptEl SalvadorEnglandEritreaEthiopiaEuropeFijiFranceGermanyGhanaGreeceGrenadaGuatemalaGuyanaHaitiHondurasHong KongHungaryIndiaIndonesiaIranIraqIrelandIsraelItalyJamaicaJapanJordanKazakhstanKenyaKoreaKuwaitLaosLatin AmericaLatviaLebanonLiberiaLithuaniaMalaysiaMexicoMicronesiaMiddle AfricaMoldovaMoroccoNepalNetherlandsNicaraguaNigeriaNorth AmericaNorth MacedoniaNorthern AfricaNorthern EuropeNorwayOceaniaPakistanPanamaPeruPhilippinesPolandPortugalRomaniaRussiaSaudi ArabiaScotlandSenegalSerbiaSierra LeoneSingaporeSomaliaSouth AfricaSouth AmericaSouth Central AsiaSouth Eastern AsiaSouthern EuropeSpainSri LankaSt. Vincent and the GrenadinesSudanSwedenSwitzerlandSyriaTaiwanThailandTrinidad and TobagoTurkeyUgandaUkraineUruguayUzbekistanVenezuelaVietnamWest IndiesWestern AfricaWestern AsiaWestern EuropeYemenZaireZimbabweAzores
Irish
Race
Ancestry
AfghanAfricanAlaska NativeAlaskan AthabascanAlbanianAleutAlsatianAmericanApacheArabArapahoArgentineanArmenianAssyrian/Chaldean/SyriacAustralianAustrianBahamianBangladeshiBarbadianBasqueBelgianBelizeanBermudanBhutaneseBlackfeetBolivianBrazilianBritishBritish West IndianBulgarianBurmeseCajunCambodianCanadianCape VerdeanCarpatho RusynCelticCentral AmericanCentral American IndianCherokeeCheyenneChickasawChileanChineseChippewaChoctawColombianColvilleComancheCosta RicanCreeCreekCroatianCrowCubanCypriotCzechCzechoslovakianDanishDelawareDominicanDutchDutch West IndianEastern EuropeanEcuadorianEgyptianEnglishEstonianEthiopianEuropeanFijianFilipinoFinnishFrenchFrench American IndianFrench CanadianGermanGerman RussianGhanaianGreekGuamanian/ChamorroGuatemalanGuyaneseHaitianHmongHonduranHopiHoumaHungarianIcelanderIndian (Asian)IndonesianInupiatIranianIraqiIrishIroquoisIsraeliItalianJamaicanJapaneseJordanianKenyanKiowaKoreanLaotianLatvianLebaneseLiberianLithuanianLumbeeLuxembourgerMacedonianMalaysianMalteseMarshalleseMenomineeMexicanMexican American IndianMongolianMoroccanNative HawaiianNavajoNepaleseNew ZealanderNicaraguanNigerianNorthern EuropeanNorwegianOkinawanOsageOttawaPaiutePakistaniPalestinianPanamanianParaguayanPennsylvania GermanPeruvianPimaPolishPortuguesePotawatomiPuebloPuerto RicanPuget Sound SalishRomanianRussianSalvadoranSamoanScandinavianScotch-IrishScottishSeminoleSenegaleseSerbianShoshoneSierra LeoneanSiouxSlavicSlovakSloveneSomaliSouth AfricanSouth AmericanSouth American IndianSoviet UnionSpaniardSpanishSpanish AmericanSpanish American IndianSri LankanSubsaharan AfricanSudaneseSwedishSwissSyrianTaiwaneseThaiTlingit-HaidaTohono O'OdhamTonganTrinidadian and TobagonianTsimshianTurkishU.S. Virgin IslanderUgandanUkrainianUruguayanUteVenezuelanVietnameseWelshWest IndianYakamaYaquiYugoslavianYumanYup'ikZimbabwean
Immigration
NonimmigrantsImmigrantsAfghanistanAfricaAlbaniaArgentinaArmeniaAsiaAustraliaAustriaBahamasBangladeshBarbadosBelarusBelgiumBelizeBoliviaBosnia and HerzegovinaBrazilBulgariaBurma/MyanmarCabo VerdeCambodiaCameroonCanadaCaribbeanCentral AmericaChileChinaColombiaCongoCosta RicaCroatiaCubaCzechoslovakiaDenmarkDominicaDominican RepublicEastern AfricaEastern AsiaEastern EuropeEcuadorEgyptEl SalvadorEnglandEritreaEthiopiaEuropeFijiFranceGermanyGhanaGreeceGrenadaGuatemalaGuyanaHaitiHondurasHong KongHungaryIndiaIndonesiaIranIraqIrelandIsraelItalyJamaicaJapanJordanKazakhstanKenyaKoreaKuwaitLaosLatin AmericaLatviaLebanonLiberiaLithuaniaMalaysiaMexicoMicronesiaMiddle AfricaMoldovaMoroccoNepalNetherlandsNicaraguaNigeriaNorth AmericaNorth MacedoniaNorthern AfricaNorthern EuropeNorwayOceaniaPakistanPanamaPeruPolandPortugalRomaniaRussiaSaudi ArabiaScotlandSenegalSerbiaSierra LeoneSingaporeSomaliaSouth AfricaSouth AmericaSouth Central AsiaSouth Eastern AsiaSouthern EuropeSpainSri LankaSt. Vincent and the GrenadinesSudanSwedenSwitzerlandSyriaTaiwanThailandTrinidad and TobagoTurkeyUgandaUkraineUruguayUzbekistanVenezuelaVietnamWest IndiesWestern AfricaWestern AsiaWestern EuropeYemenZaireZimbabweAzores
College, Under 1 year
Income
Poverty
Unemployment
Labor Participation
Family Structure
Vehicle Availability
Education Level
Disability

College, Under 1 year Comparison

Immigrants from Philippines

Irish

Fair
Good
64.8%
COLLEGE, UNDER 1 YEAR
30.1/ 100
METRIC RATING
190th/ 347
METRIC RANK
66.0%
COLLEGE, UNDER 1 YEAR
70.3/ 100
METRIC RATING
155th/ 347
METRIC RANK

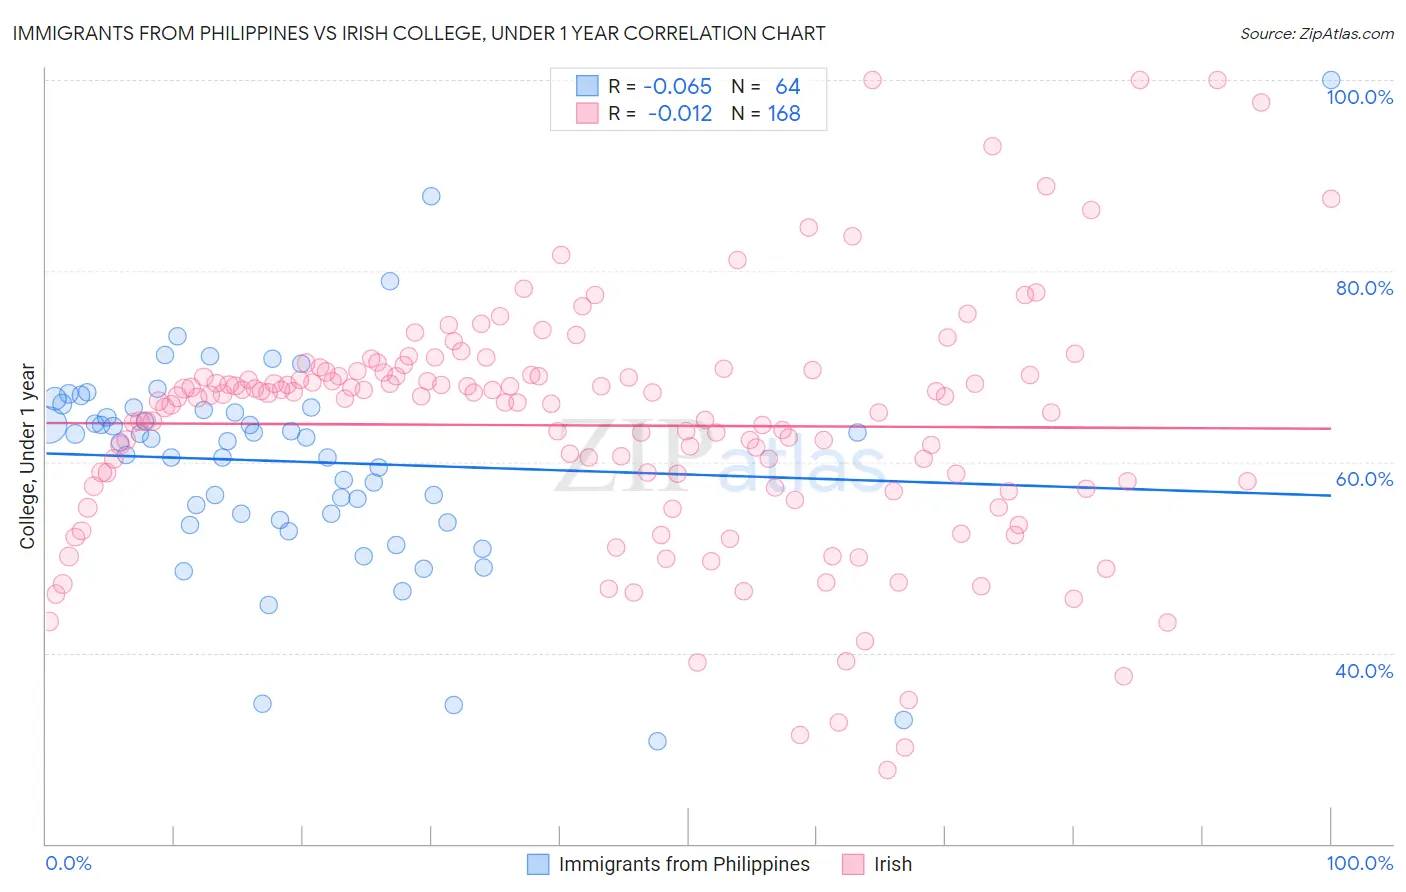
Immigrants from Philippines vs Irish College, Under 1 year Correlation Chart

The statistical analysis conducted on geographies consisting of 471,303,871 people shows a slight negative correlation between the proportion of Immigrants from Philippines and percentage of population with at least college, under 1 year education in the United States with a correlation coefficient (R) of -0.065 and weighted average of 64.8%. Similarly, the statistical analysis conducted on geographies consisting of 580,693,587 people shows no correlation between the proportion of Irish and percentage of population with at least college, under 1 year education in the United States with a correlation coefficient (R) of -0.012 and weighted average of 66.0%, a difference of 1.9%.
Immigrants from Philippines vs Irish College, Under 1 year

College, Under 1 year Correlation Summary

MeasurementImmigrants from PhilippinesIrish
Minimum30.7%27.7%
Maximum100.0%100.0%
Range69.3%72.3%
Mean60.1%63.8%
Median62.3%66.7%
Interquartile 25% (IQ1)54.2%57.4%
Interquartile 75% (IQ3)65.6%69.1%
Interquartile Range (IQR)11.3%11.7%
Standard Deviation (Sample)11.4%12.6%
Standard Deviation (Population)11.3%12.6%

Similar Demographics by College, Under 1 year

Demographics Similar to Immigrants from Philippines by College, Under 1 year

In terms of college, under 1 year, the demographic groups most similar to Immigrants from Philippines are Spanish (64.9%, a difference of 0.080%), Immigrants from Albania (64.9%, a difference of 0.10%), Immigrants from Armenia (64.7%, a difference of 0.11%), Immigrants from Thailand (64.7%, a difference of 0.17%), and Slovak (64.7%, a difference of 0.19%).
DemographicsRating | RankCollege, Under 1 year
Immigrants | Poland
42.6
/100
|
#183
Average
65.2%
Bermudans
42.0
/100
|
#184
Average
65.2%
Sri Lankans
41.7
/100
|
#185
Average
65.2%
Immigrants | Sierra Leone
39.7
/100
|
#186
Fair
65.1%
Immigrants | Southern Europe
34.3
/100
|
#187
Fair
64.9%
Immigrants | Albania
32.0
/100
|
#188
Fair
64.9%
Spanish
31.6
/100
|
#189
Fair
64.9%
Immigrants | Philippines
30.1
/100
|
#190
Fair
64.8%
Immigrants | Armenia
28.1
/100
|
#191
Fair
64.7%
Immigrants | Thailand
27.0
/100
|
#192
Fair
64.7%
Slovaks
26.7
/100
|
#193
Fair
64.7%
Immigrants | Cameroon
24.6
/100
|
#194
Fair
64.6%
Immigrants | South Eastern Asia
22.1
/100
|
#195
Fair
64.5%
Tongans
21.2
/100
|
#196
Fair
64.5%
Costa Ricans
19.6
/100
|
#197
Poor
64.4%

Demographics Similar to Irish by College, Under 1 year

In terms of college, under 1 year, the demographic groups most similar to Irish are Welsh (66.0%, a difference of 0.020%), Immigrants from Eritrea (66.1%, a difference of 0.090%), Sierra Leonean (66.0%, a difference of 0.12%), Celtic (65.9%, a difference of 0.15%), and Belgian (66.2%, a difference of 0.18%).
DemographicsRating | RankCollege, Under 1 year
Taiwanese
78.6
/100
|
#148
Good
66.4%
Immigrants | Venezuela
77.9
/100
|
#149
Good
66.3%
Immigrants | Iraq
77.1
/100
|
#150
Good
66.3%
Immigrants | Sudan
76.0
/100
|
#151
Good
66.2%
Sudanese
74.1
/100
|
#152
Good
66.2%
Belgians
73.7
/100
|
#153
Good
66.2%
Immigrants | Eritrea
71.9
/100
|
#154
Good
66.1%
Irish
70.3
/100
|
#155
Good
66.0%
Welsh
69.9
/100
|
#156
Good
66.0%
Sierra Leoneans
67.8
/100
|
#157
Good
66.0%
Celtics
67.3
/100
|
#158
Good
65.9%
Tlingit-Haida
66.4
/100
|
#159
Good
65.9%
Albanians
66.1
/100
|
#160
Good
65.9%
Brazilians
66.0
/100
|
#161
Good
65.9%
Koreans
65.3
/100
|
#162
Good
65.9%