Immigrants from Ukraine vs Irish College, Under 1 year
COMPARE
Immigrants from Ukraine
Irish
College, Under 1 year
College, Under 1 year Comparison
Immigrants from Ukraine
Irish
67.5%
COLLEGE, UNDER 1 YEAR
94.7/ 100
METRIC RATING
118th/ 347
METRIC RANK
66.0%
COLLEGE, UNDER 1 YEAR
70.3/ 100
METRIC RATING
155th/ 347
METRIC RANK
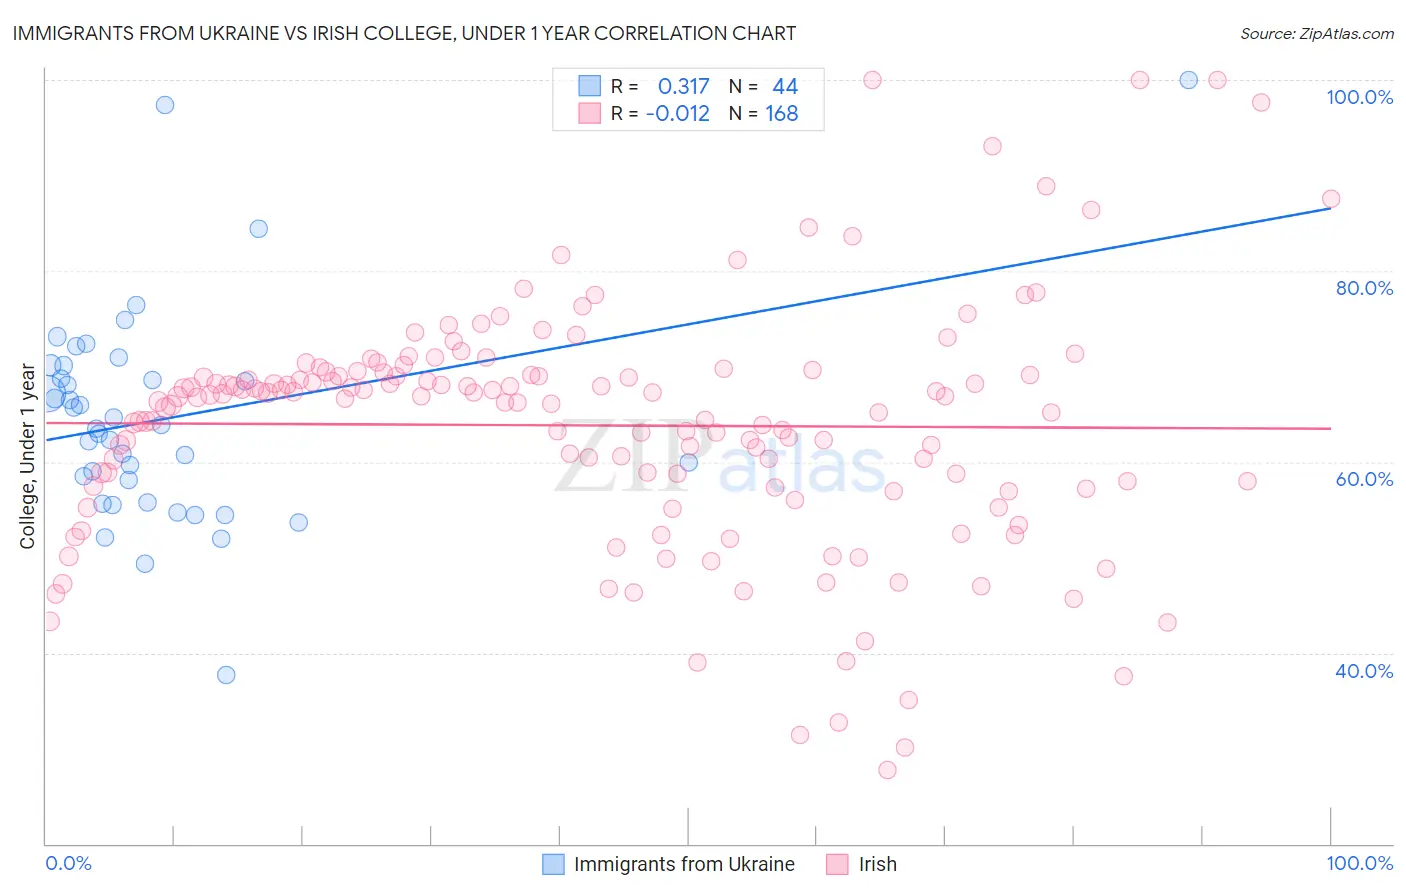
Immigrants from Ukraine vs Irish College, Under 1 year Correlation Chart
The statistical analysis conducted on geographies consisting of 289,712,789 people shows a mild positive correlation between the proportion of Immigrants from Ukraine and percentage of population with at least college, under 1 year education in the United States with a correlation coefficient (R) of 0.317 and weighted average of 67.5%. Similarly, the statistical analysis conducted on geographies consisting of 580,693,587 people shows no correlation between the proportion of Irish and percentage of population with at least college, under 1 year education in the United States with a correlation coefficient (R) of -0.012 and weighted average of 66.0%, a difference of 2.2%.
College, Under 1 year Correlation Summary
| Measurement | Immigrants from Ukraine | Irish |
| Minimum | 37.7% | 27.7% |
| Maximum | 100.0% | 100.0% |
| Range | 62.3% | 72.3% |
| Mean | 64.5% | 63.8% |
| Median | 63.6% | 66.7% |
| Interquartile 25% (IQ1) | 56.9% | 57.4% |
| Interquartile 75% (IQ3) | 69.4% | 69.1% |
| Interquartile Range (IQR) | 12.5% | 11.7% |
| Standard Deviation (Sample) | 11.3% | 12.6% |
| Standard Deviation (Population) | 11.2% | 12.6% |
Similar Demographics by College, Under 1 year
Demographics Similar to Immigrants from Ukraine by College, Under 1 year
In terms of college, under 1 year, the demographic groups most similar to Immigrants from Ukraine are Lebanese (67.5%, a difference of 0.010%), Pakistani (67.5%, a difference of 0.030%), Immigrants from Nepal (67.5%, a difference of 0.040%), Basque (67.6%, a difference of 0.13%), and Chilean (67.6%, a difference of 0.14%).
| Demographics | Rating | Rank | College, Under 1 year |
| Ukrainians | 95.8 /100 | #111 | Exceptional 67.7% |
| Macedonians | 95.7 /100 | #112 | Exceptional 67.6% |
| Syrians | 95.6 /100 | #113 | Exceptional 67.6% |
| Chileans | 95.3 /100 | #114 | Exceptional 67.6% |
| Basques | 95.2 /100 | #115 | Exceptional 67.6% |
| Immigrants | Nepal | 94.9 /100 | #116 | Exceptional 67.5% |
| Pakistanis | 94.8 /100 | #117 | Exceptional 67.5% |
| Immigrants | Ukraine | 94.7 /100 | #118 | Exceptional 67.5% |
| Lebanese | 94.6 /100 | #119 | Exceptional 67.5% |
| Serbians | 93.9 /100 | #120 | Exceptional 67.4% |
| Slovenes | 93.3 /100 | #121 | Exceptional 67.3% |
| Immigrants | Jordan | 92.8 /100 | #122 | Exceptional 67.3% |
| Immigrants | Northern Africa | 92.7 /100 | #123 | Exceptional 67.2% |
| Arabs | 92.6 /100 | #124 | Exceptional 67.2% |
| Italians | 91.8 /100 | #125 | Exceptional 67.2% |
Demographics Similar to Irish by College, Under 1 year
In terms of college, under 1 year, the demographic groups most similar to Irish are Welsh (66.0%, a difference of 0.020%), Immigrants from Eritrea (66.1%, a difference of 0.090%), Sierra Leonean (66.0%, a difference of 0.12%), Celtic (65.9%, a difference of 0.15%), and Belgian (66.2%, a difference of 0.18%).
| Demographics | Rating | Rank | College, Under 1 year |
| Taiwanese | 78.6 /100 | #148 | Good 66.4% |
| Immigrants | Venezuela | 77.9 /100 | #149 | Good 66.3% |
| Immigrants | Iraq | 77.1 /100 | #150 | Good 66.3% |
| Immigrants | Sudan | 76.0 /100 | #151 | Good 66.2% |
| Sudanese | 74.1 /100 | #152 | Good 66.2% |
| Belgians | 73.7 /100 | #153 | Good 66.2% |
| Immigrants | Eritrea | 71.9 /100 | #154 | Good 66.1% |
| Irish | 70.3 /100 | #155 | Good 66.0% |
| Welsh | 69.9 /100 | #156 | Good 66.0% |
| Sierra Leoneans | 67.8 /100 | #157 | Good 66.0% |
| Celtics | 67.3 /100 | #158 | Good 65.9% |
| Tlingit-Haida | 66.4 /100 | #159 | Good 65.9% |
| Albanians | 66.1 /100 | #160 | Good 65.9% |
| Brazilians | 66.0 /100 | #161 | Good 65.9% |
| Koreans | 65.3 /100 | #162 | Good 65.9% |