Scandinavian vs Immigrants from Hungary 3rd Grade
COMPARE
Scandinavian
Immigrants from Hungary
3rd Grade
3rd Grade Comparison
Scandinavians
Immigrants from Hungary
98.4%
3RD GRADE
100.0/ 100
METRIC RATING
32nd/ 347
METRIC RANK
97.9%
3RD GRADE
88.8/ 100
METRIC RATING
132nd/ 347
METRIC RANK
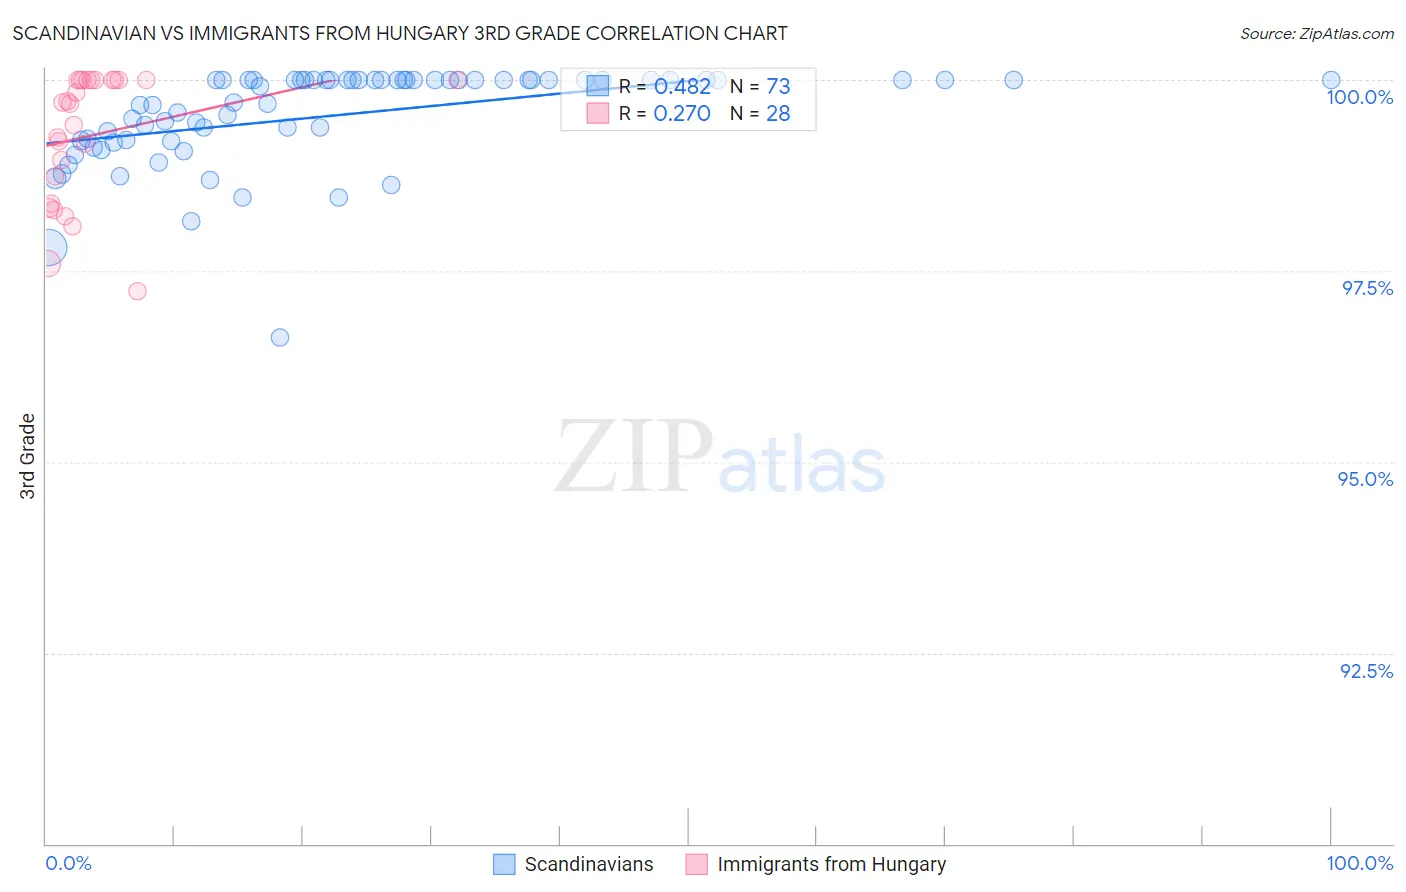
Scandinavian vs Immigrants from Hungary 3rd Grade Correlation Chart
The statistical analysis conducted on geographies consisting of 472,660,430 people shows a moderate positive correlation between the proportion of Scandinavians and percentage of population with at least 3rd grade education in the United States with a correlation coefficient (R) of 0.482 and weighted average of 98.4%. Similarly, the statistical analysis conducted on geographies consisting of 195,707,305 people shows a weak positive correlation between the proportion of Immigrants from Hungary and percentage of population with at least 3rd grade education in the United States with a correlation coefficient (R) of 0.270 and weighted average of 97.9%, a difference of 0.51%.
3rd Grade Correlation Summary
| Measurement | Scandinavian | Immigrants from Hungary |
| Minimum | 96.6% | 97.2% |
| Maximum | 100.0% | 100.0% |
| Range | 3.4% | 2.8% |
| Mean | 99.5% | 99.3% |
| Median | 100.0% | 99.7% |
| Interquartile 25% (IQ1) | 99.2% | 98.6% |
| Interquartile 75% (IQ3) | 100.0% | 100.0% |
| Interquartile Range (IQR) | 0.80% | 1.4% |
| Standard Deviation (Sample) | 0.64% | 0.84% |
| Standard Deviation (Population) | 0.64% | 0.83% |
Similar Demographics by 3rd Grade
Demographics Similar to Scandinavians by 3rd Grade
In terms of 3rd grade, the demographic groups most similar to Scandinavians are Czech (98.4%, a difference of 0.0%), French Canadian (98.4%, a difference of 0.010%), European (98.4%, a difference of 0.010%), French (98.4%, a difference of 0.020%), and Chinese (98.4%, a difference of 0.020%).
| Demographics | Rating | Rank | 3rd Grade |
| Scotch-Irish | 100.0 /100 | #25 | Exceptional 98.5% |
| Aleuts | 100.0 /100 | #26 | Exceptional 98.5% |
| Croatians | 100.0 /100 | #27 | Exceptional 98.5% |
| French | 100.0 /100 | #28 | Exceptional 98.4% |
| French Canadians | 100.0 /100 | #29 | Exceptional 98.4% |
| Europeans | 100.0 /100 | #30 | Exceptional 98.4% |
| Czechs | 100.0 /100 | #31 | Exceptional 98.4% |
| Scandinavians | 100.0 /100 | #32 | Exceptional 98.4% |
| Chinese | 100.0 /100 | #33 | Exceptional 98.4% |
| Swiss | 100.0 /100 | #34 | Exceptional 98.4% |
| Arapaho | 100.0 /100 | #35 | Exceptional 98.4% |
| British | 99.9 /100 | #36 | Exceptional 98.4% |
| Italians | 99.9 /100 | #37 | Exceptional 98.4% |
| Chippewa | 99.9 /100 | #38 | Exceptional 98.4% |
| Latvians | 99.9 /100 | #39 | Exceptional 98.4% |
Demographics Similar to Immigrants from Hungary by 3rd Grade
In terms of 3rd grade, the demographic groups most similar to Immigrants from Hungary are Immigrants from Bulgaria (97.9%, a difference of 0.0%), Immigrants from Kuwait (97.9%, a difference of 0.0%), Seminole (97.9%, a difference of 0.0%), Cambodian (97.9%, a difference of 0.010%), and Spaniard (97.9%, a difference of 0.010%).
| Demographics | Rating | Rank | 3rd Grade |
| Immigrants | Saudi Arabia | 93.5 /100 | #125 | Exceptional 98.0% |
| Immigrants | Zimbabwe | 93.4 /100 | #126 | Exceptional 98.0% |
| Ute | 93.2 /100 | #127 | Exceptional 98.0% |
| Colville | 92.1 /100 | #128 | Exceptional 98.0% |
| Immigrants | Serbia | 91.9 /100 | #129 | Exceptional 98.0% |
| Immigrants | Europe | 91.2 /100 | #130 | Exceptional 98.0% |
| Immigrants | Bulgaria | 89.1 /100 | #131 | Excellent 97.9% |
| Immigrants | Hungary | 88.8 /100 | #132 | Excellent 97.9% |
| Immigrants | Kuwait | 88.7 /100 | #133 | Excellent 97.9% |
| Seminole | 88.7 /100 | #134 | Excellent 97.9% |
| Cambodians | 88.1 /100 | #135 | Excellent 97.9% |
| Spaniards | 87.9 /100 | #136 | Excellent 97.9% |
| Immigrants | Romania | 87.9 /100 | #137 | Excellent 97.9% |
| Israelis | 86.6 /100 | #138 | Excellent 97.9% |
| Blackfeet | 86.3 /100 | #139 | Excellent 97.9% |