Scandinavian vs Immigrants from Germany Doctorate Degree
COMPARE
Scandinavian
Immigrants from Germany
Doctorate Degree
Doctorate Degree Comparison
Scandinavians
Immigrants from Germany
1.8%
DOCTORATE DEGREE
48.0/ 100
METRIC RATING
180th/ 347
METRIC RANK
2.1%
DOCTORATE DEGREE
97.3/ 100
METRIC RATING
108th/ 347
METRIC RANK
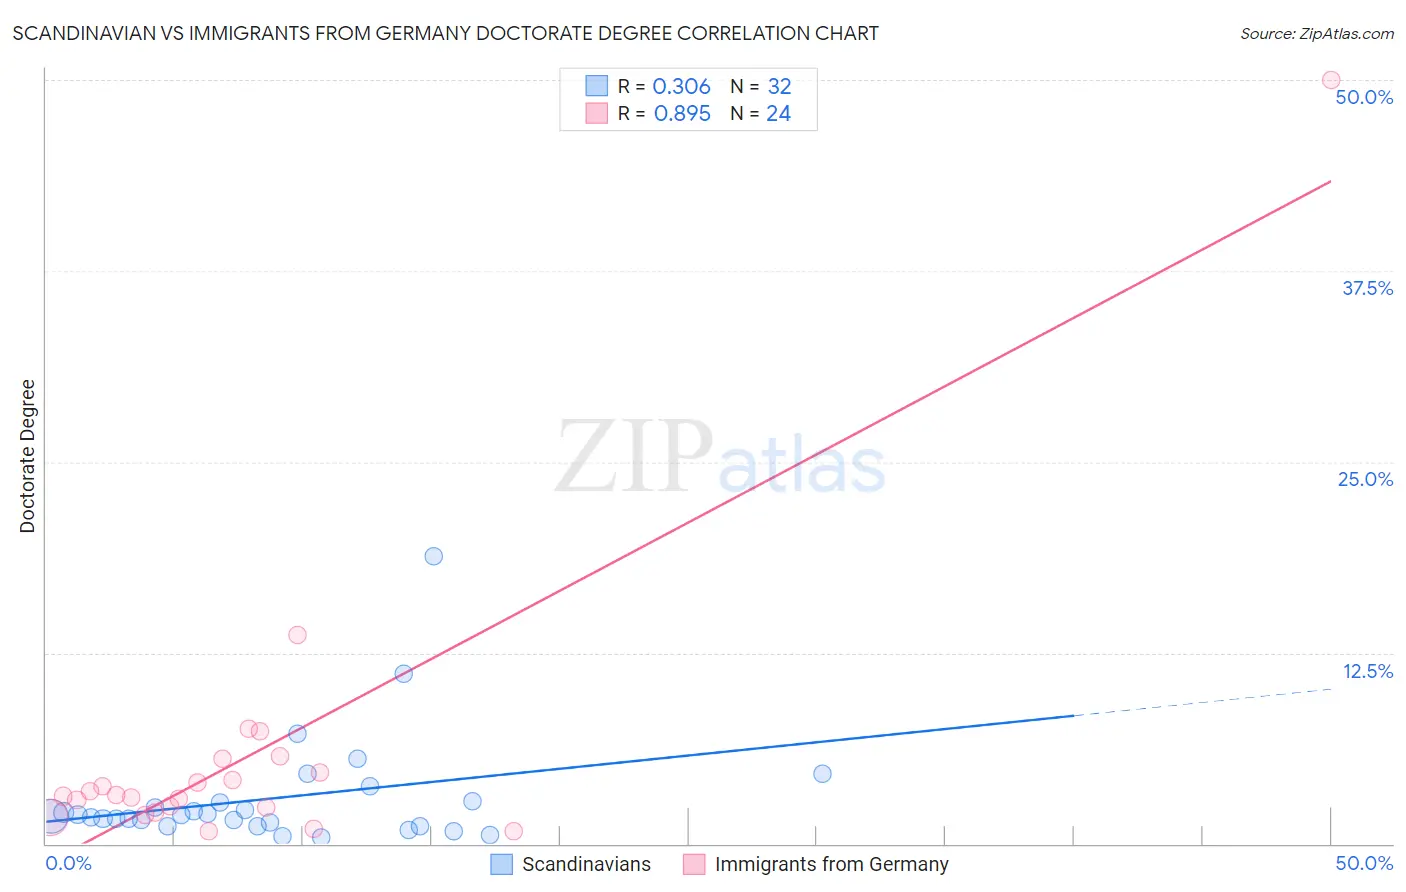
Scandinavian vs Immigrants from Germany Doctorate Degree Correlation Chart
The statistical analysis conducted on geographies consisting of 462,476,987 people shows a mild positive correlation between the proportion of Scandinavians and percentage of population with at least doctorate degree education in the United States with a correlation coefficient (R) of 0.306 and weighted average of 1.8%. Similarly, the statistical analysis conducted on geographies consisting of 457,324,098 people shows a very strong positive correlation between the proportion of Immigrants from Germany and percentage of population with at least doctorate degree education in the United States with a correlation coefficient (R) of 0.895 and weighted average of 2.1%, a difference of 13.4%.
Doctorate Degree Correlation Summary
| Measurement | Scandinavian | Immigrants from Germany |
| Minimum | 0.41% | 0.81% |
| Maximum | 18.8% | 50.0% |
| Range | 18.4% | 49.2% |
| Mean | 3.0% | 5.8% |
| Median | 1.8% | 3.1% |
| Interquartile 25% (IQ1) | 1.3% | 2.2% |
| Interquartile 75% (IQ3) | 2.7% | 5.1% |
| Interquartile Range (IQR) | 1.4% | 2.9% |
| Standard Deviation (Sample) | 3.6% | 9.8% |
| Standard Deviation (Population) | 3.6% | 9.6% |
Similar Demographics by Doctorate Degree
Demographics Similar to Scandinavians by Doctorate Degree
In terms of doctorate degree, the demographic groups most similar to Scandinavians are Ghanaian (1.8%, a difference of 0.050%), French (1.8%, a difference of 0.12%), Iraqi (1.8%, a difference of 0.18%), Spanish (1.8%, a difference of 0.19%), and Immigrants from Thailand (1.8%, a difference of 0.21%).
| Demographics | Rating | Rank | Doctorate Degree |
| Norwegians | 50.0 /100 | #173 | Average 1.8% |
| Immigrants | Bangladesh | 50.0 /100 | #174 | Average 1.8% |
| Immigrants | Thailand | 49.4 /100 | #175 | Average 1.8% |
| Spanish | 49.3 /100 | #176 | Average 1.8% |
| Iraqis | 49.2 /100 | #177 | Average 1.8% |
| French | 48.8 /100 | #178 | Average 1.8% |
| Ghanaians | 48.3 /100 | #179 | Average 1.8% |
| Scandinavians | 48.0 /100 | #180 | Average 1.8% |
| Immigrants | Immigrants | 46.2 /100 | #181 | Average 1.8% |
| Immigrants | Afghanistan | 44.3 /100 | #182 | Average 1.8% |
| Finns | 42.1 /100 | #183 | Average 1.8% |
| Nigerians | 39.9 /100 | #184 | Fair 1.8% |
| Slovaks | 36.4 /100 | #185 | Fair 1.8% |
| Peruvians | 34.4 /100 | #186 | Fair 1.8% |
| Czechoslovakians | 33.0 /100 | #187 | Fair 1.8% |
Demographics Similar to Immigrants from Germany by Doctorate Degree
In terms of doctorate degree, the demographic groups most similar to Immigrants from Germany are Ukrainian (2.1%, a difference of 0.060%), Brazilian (2.1%, a difference of 0.13%), Immigrants from Pakistan (2.1%, a difference of 0.19%), Syrian (2.1%, a difference of 0.21%), and European (2.1%, a difference of 0.22%).
| Demographics | Rating | Rank | Doctorate Degree |
| Immigrants | Eastern Africa | 98.2 /100 | #101 | Exceptional 2.1% |
| Immigrants | Chile | 98.1 /100 | #102 | Exceptional 2.1% |
| Romanians | 98.1 /100 | #103 | Exceptional 2.1% |
| Austrians | 98.0 /100 | #104 | Exceptional 2.1% |
| Arabs | 97.8 /100 | #105 | Exceptional 2.1% |
| Sudanese | 97.7 /100 | #106 | Exceptional 2.1% |
| Europeans | 97.5 /100 | #107 | Exceptional 2.1% |
| Immigrants | Germany | 97.3 /100 | #108 | Exceptional 2.1% |
| Ukrainians | 97.2 /100 | #109 | Exceptional 2.1% |
| Brazilians | 97.2 /100 | #110 | Exceptional 2.1% |
| Immigrants | Pakistan | 97.1 /100 | #111 | Exceptional 2.1% |
| Syrians | 97.1 /100 | #112 | Exceptional 2.1% |
| Immigrants | Italy | 96.9 /100 | #113 | Exceptional 2.1% |
| Immigrants | Croatia | 96.8 /100 | #114 | Exceptional 2.1% |
| Taiwanese | 96.7 /100 | #115 | Exceptional 2.1% |